


A Close Look at U.S. GDP, Part 2
Riding The Inflation-Growth Roller Coaster

· What looked like a dramatic stop in 2019, was really a rapid slowdown to a disappointingly low potential growth rate. If the Fed observes the economy downshifting to a negative potential growth rate, they might again mistake that for a sentiment-driven recession and curtail monetary tightening.
· In the past few months production has been rapidly accelerating and is approaching levels not seen since before the Great Financial Crisis. The Fed is slamming the door shut on the industrial sector just as the supply chain is starting to become unblocked and inventories are rebuilding.
· That means “equilibrium” is stagflation and falling real wages while the Fed is busy “stimulating” the economy, and in the absence of stimulus the equilibrium is deflation and rising real wages. Neither is pleasant, but it can only be made worse by government efforts to avoid the painful reality.
The Fed has spooked equity markets with threats of “defeating” inflation using a series of fifty-basis point rate increases that only stop when an economic slowdown is ongoing. That fear immediately kicked off the usual discussion on whether the “Fed put” has disappeared, or if it even existed in the first place. The problem with the “Fed put” discussion is that it ignores the reality that stock market sentiment is one of the indicators the Fed uses to guide policy, but it is neither the only indictor nor is it currently the binding constraint on the Fed’s policy options. This note continues the discussion from Part 1 about what U.S. GDP data can tell investors about the Fed’s most likely course of actions, its constraints.
The Inflation-Growth Roller Coaster
The Fed has been talking tough and overly leveraged speculators are clearly getting squeezed, but this writer is skeptical that the FOMC will intentionally take the economy over such a precipice. I wrote in March 2019 (link provided to Premium Plus clients) that expectations for a recession were misplaced at that time and were the result of perverse incentives and outdated economic models. The perverse incentive happens because, in our headline-driven world, nobody cares who is the second person to “forecast” a recession. Charts 1 and 2 below show how a declining potential growth rate messes with analyst forecasts. The problem was compounded in 2019 by the fact that economic models were clearly not set up to account for the rapid change in output that is possible with “just-in-time” manufacturing. What looked like a dramatic stop in 2019, was really a rapid slowdown to a disappointingly low potential growth rate.
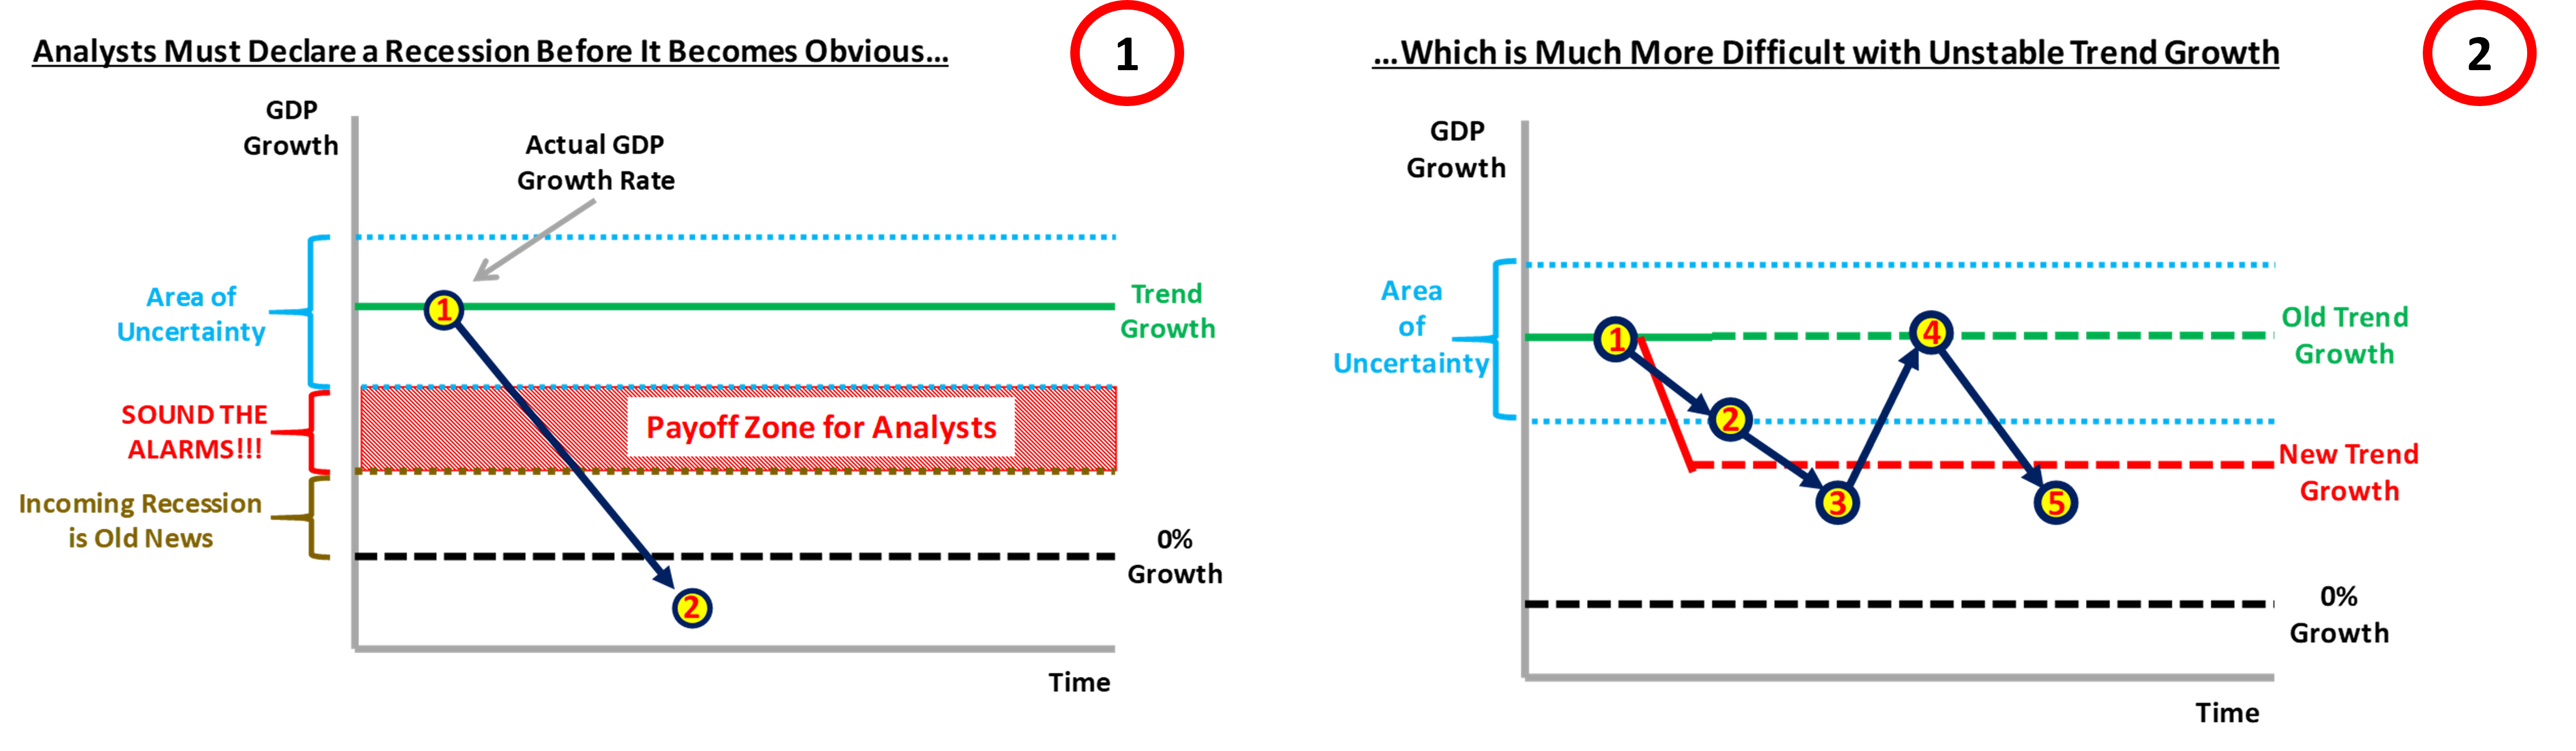
I suspect we are about to see a similar slowdown-speedup-slowdown pattern as the Fed struggles with meeting political expectations for a growth rate of 2-3% and the economic reality that potential growth is probably negative now. If the Fed observes the economy downshifting to a negative potential growth rate, they might mistake that for a sentiment-driven recession and curtail their monetary tightening. However, as was the case in the wake of the COVID shock in the first quarter of 2020, the economy will quickly move above the potential rate of growth and inflation will be back with a vengeance. As we shall see below, the second round of inflation is likely to be worse than the first because it will require diverting resources to capital expenditure to maintain output without any possibility for growth - stagflation. Charts 3 and 4 below diagram the pattern of rising inflation and falling growth rates I expect the U.S. to experience in 2022 and 2023.

Enough Rope to Hang Themselves With
The dilemma facing the Fed becomes clear once we compare recent developments in manufacturing production and producer prices. Coming out of the lockdowns the economy suffered from misfiring cylinders as gaps in inventories plagued the supply chain. Chart 5 below shows how, initially producer prices soared without production fully recovering to pre-COVID levels. However, in the past few months production has been rapidly accelerating and is approaching levels not seen since before the Great Financial Crisis. Even motor vehicle output has been rising recently, adding significantly to total output (Charts 6 & 7). Nondurable output has also been growing recently, albeit at an expensive marginal cost (Chart 8). The Fed is slamming the door shut on the industrial sector just as the supply chain is starting to become unblocked and inventories are rebuilding.

In The Pure Theory of Capital, Hayek describes money as a rope that allows for the joints in the economy to become “loose”. By this he meant that in a strict barter system, or a planned economy, it would be impossible for imbalances to occur in inventories. Money allows for indirect exchange, making a modern economy possible, but when the supply of money is changing faster than agents in the economy think it is, the potential arises for inventory mismatches.
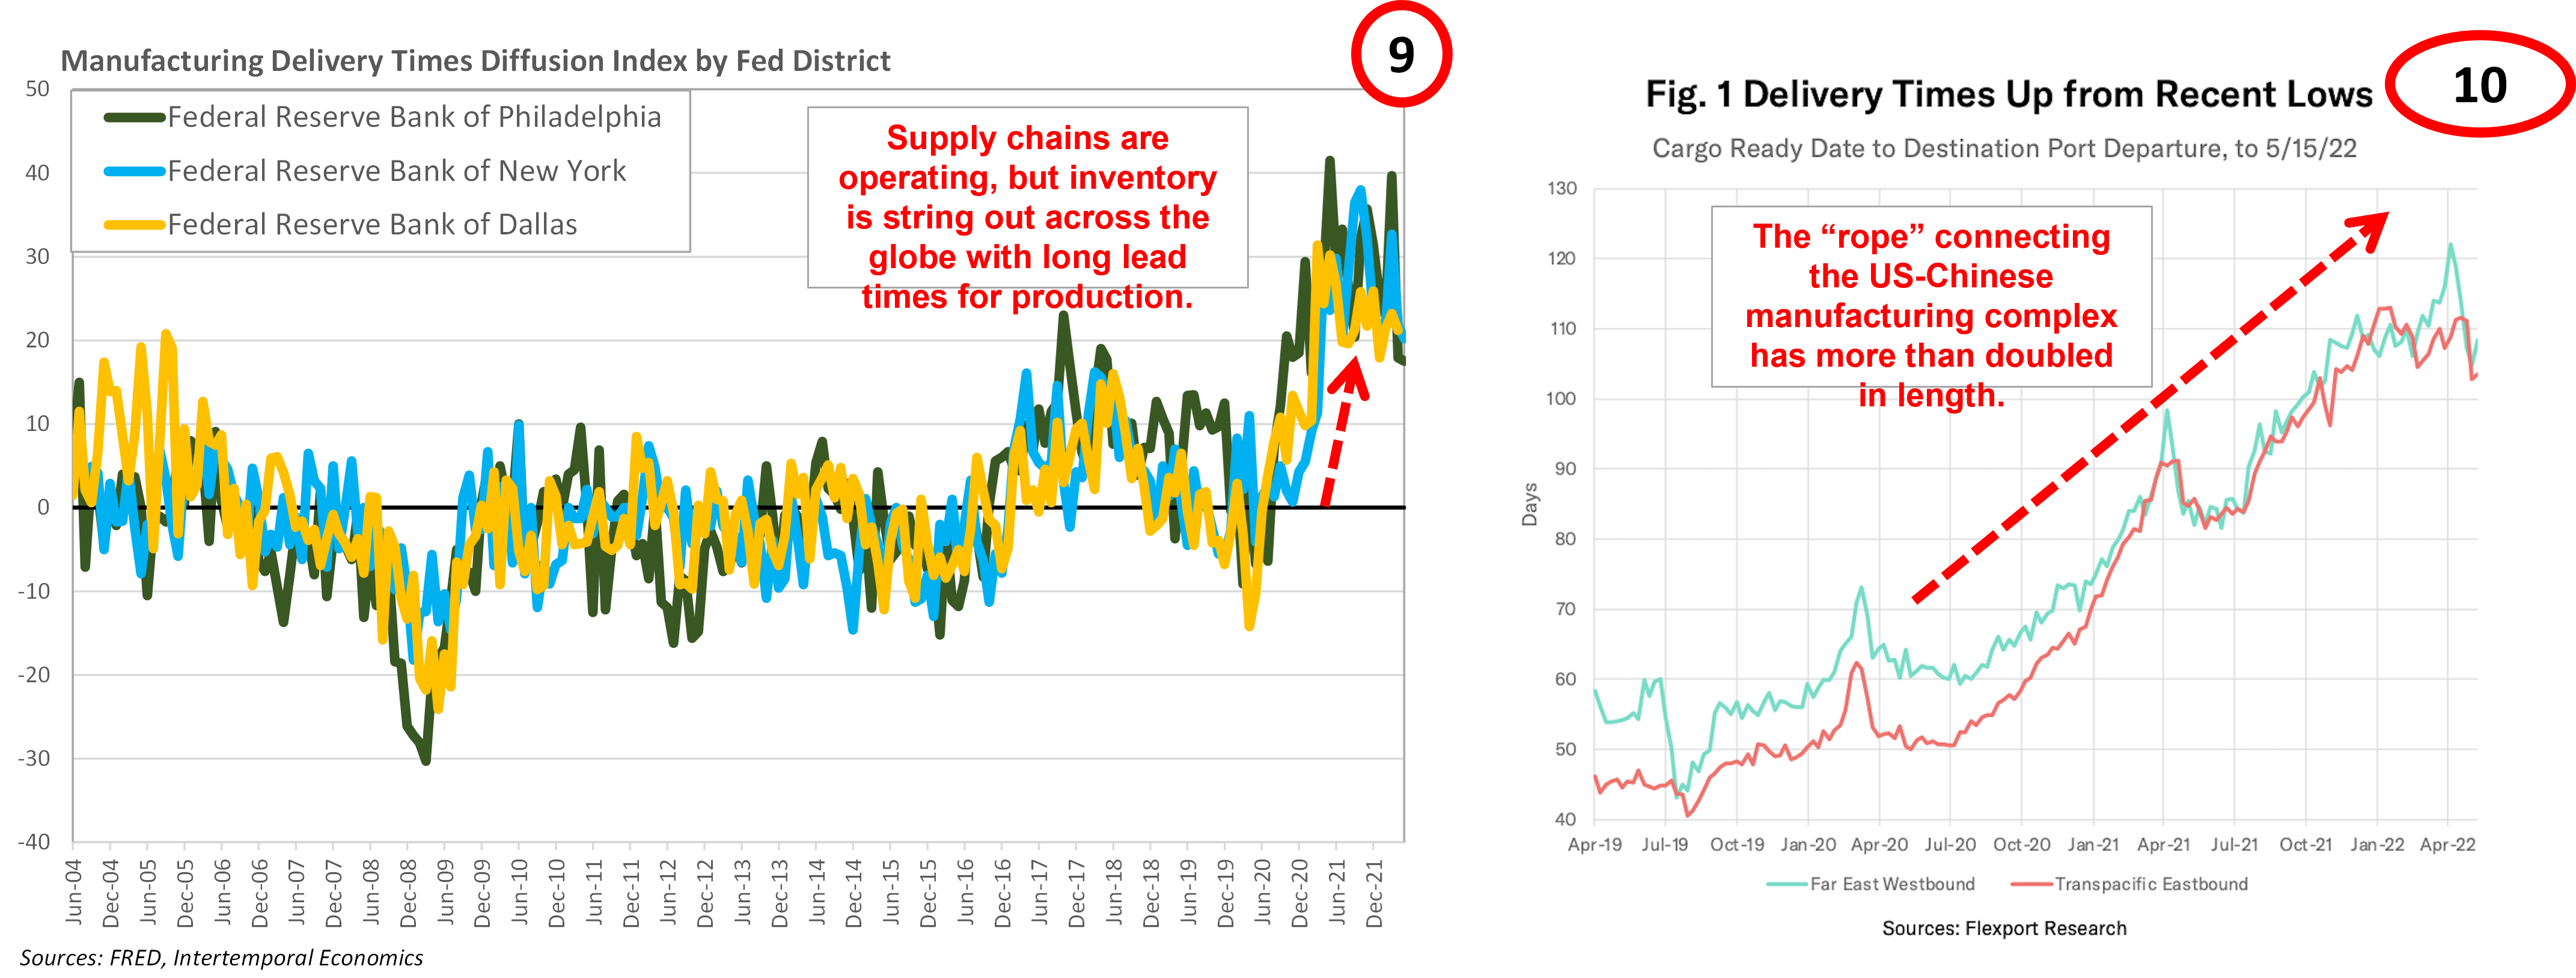
The chaos in the supply chain caused by COVID lockdowns led to a significant lengthening of time between orders and delivery of new inventory (Charts 9 & 10). Easy monetary policy helped alleviate this problem by allowing firms to place orders further into the future than they had previously been the case. The result is a longer-than-normal supply chain slowly making its way across the Pacific and waiting in line at the West Coast ports. The delay between the inventory orders and deliveries creates the potential for an overstock of inventory that triggers price cuts. Firms suddenly panicking because they have too much inventory will confuse the Fed and quickly put any tightening campaign on hold.
Signs of Trouble Already
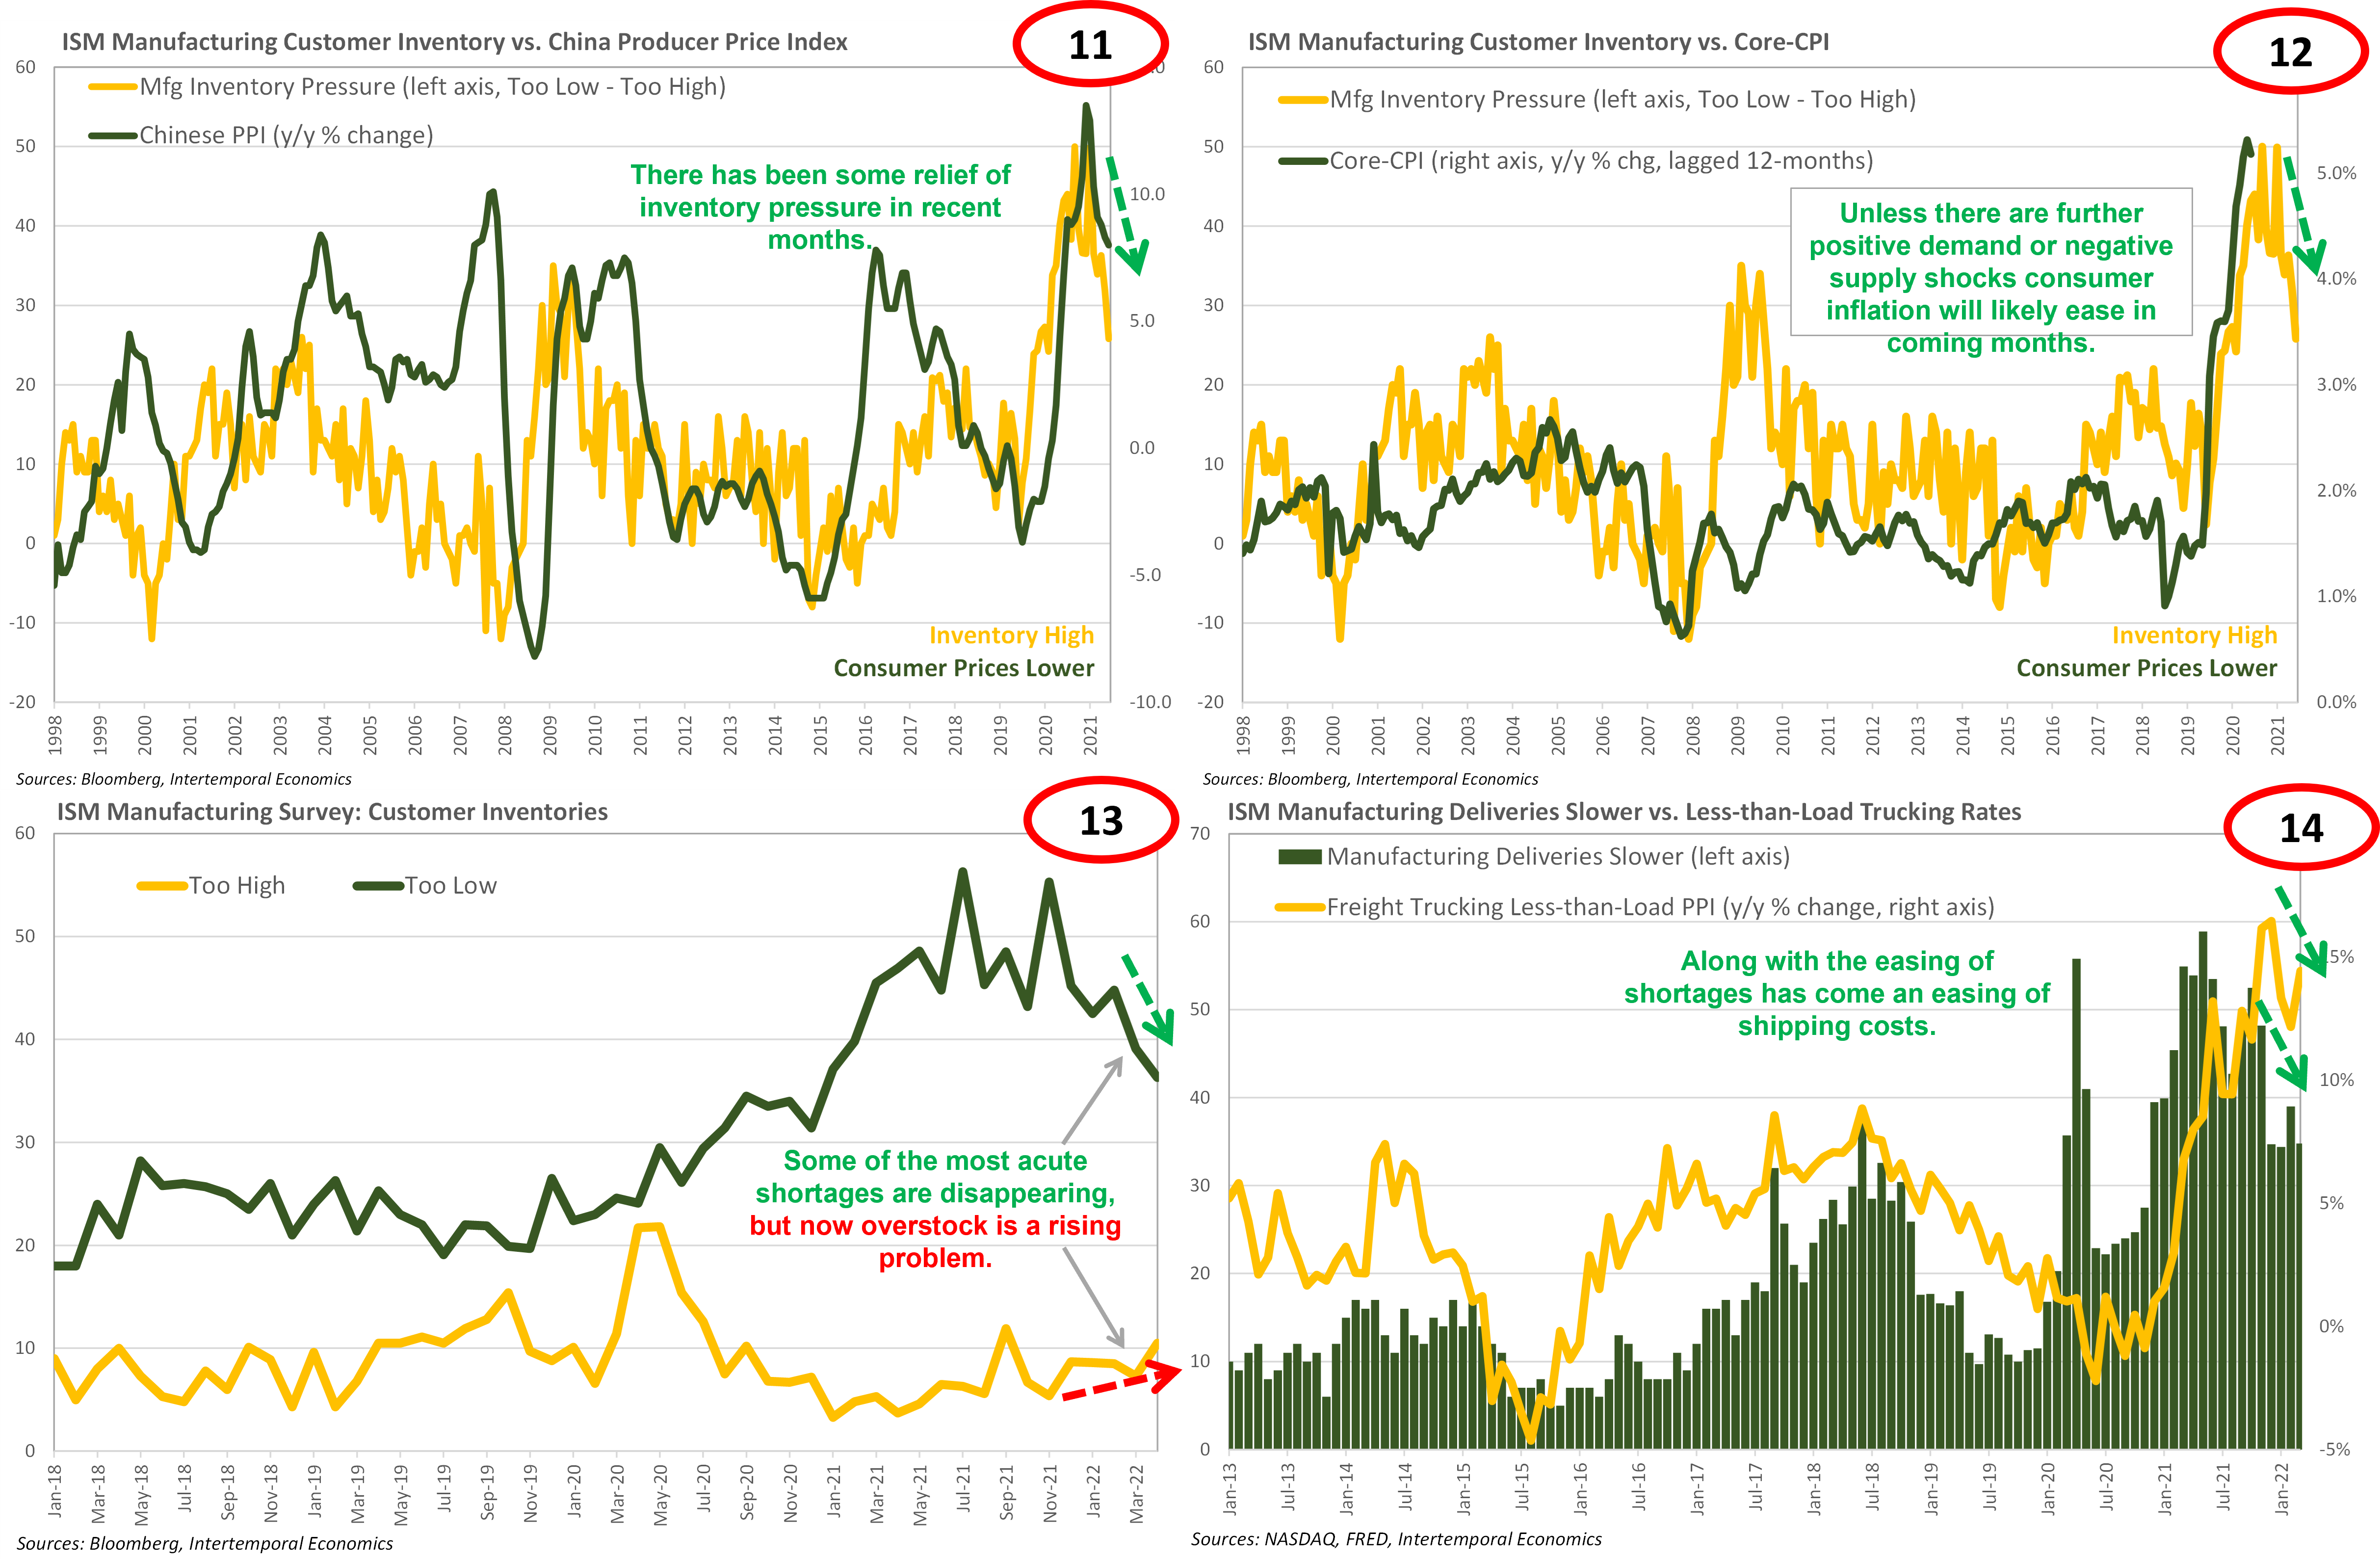
There are signs other than rising industrial production that the supply chain bottleneck has eased somewhat, and that inflationary pressure is easing with it. First, the net percentage of manufacturers reporting inventories being too low is falling rapidly and factory prices in China have responded in-kind (Chart 11). Given historical relationships, we can expect that easing of manufacturing inventory pressure to feed through to consumer prices over the next twelve months (Chart 12). Thus, the Fed is charging full tilt into inflation that is already slowing.
Worse yet, the net inventory pressure measure is not only dropping because the number of manufacturing firms reporting having too little inventory is falling, but also because the number of firms reporting inventories are too high is rising (Chart 13). As this is happening, concerns about a slowdown are already widely reporting in the trucking industry. The transportation sector reflects the “second derivative” of economic activity – accelerations and decelerations (Chart 14). I will be watching this sector closely for the expected slowdown and subsequent speed-up when the Fed chickens out.
Watching the relationship between inventory and freight transportation is essential for anyone interested in understanding what is going on in the economy. The freight transportation system has been pushed to its limits in reacting to the disruptions caused by COVID lockdowns and the subsequent change in demand patterns (Chart 15). As a result, freight transportation prices have been indicating a huge amount of effort being put into rebuilding inventories depleted in 2020 and 2021. However, the Transportation Services Index (TSI), a key monitor of freight transportation activity, shows that the strain to rebuild inventories took place without much expansion of activity because capacity did not grow. Indeed, given the extra wear-and-tear placed on the U.S. trucking fleet and reduced international travel there is likely less freight capacity in the system than pre-COVID. More disturbingly, there are tentative signs of slowdown from the detrended TSI, shown in Chart 16 below.

Mind the Fixed Capital Formation Gap
A key focus of Austrian Theory is on investment because it has a much higher elasticity than consumption does. Consumers are slow to cut back and will borrow their salary a hundred years forward if someone will let them, businesses are making a return-on-investment calculation and deciding whether to move forward with a project or not. Investment, not consumption, is the swing factor that drives economic cycles.
The good news in the first quarter was that growth of business equipment investment had ramped up after collapsing in the second half of 2021 (Chart 17). The bad news was that a mixture of bottlenecks and uncertainty have put downward pressure on investment by businesses in structures (Chart 18). Either work patterns have changed permanently, and the world is stuck with unwanted office space, or nothing has changed and eventually there will be a squeeze on office space.

Looking more closely at investment in equipment, we should perhaps not be surprised that computer and IT equipment is leading growth in investment (Charts 19 & 20). However, the scale of the growth in IT equipment by businesses is noteworthy and could end up being wasted if everyone is back at their desks in 2023 (Chart 21). Note that the increase in investment is being dominated by spending on communications equipment (Chart 22). This investment will be useful and productivity-enhancing to the extent workers are at-home more often and could make working across national borders easier. But it is hard to see how such massive growth in such a short time could avoid malinvestment in equipment that will be unwanted later.

In 2021, investment in industrial equipment remained strong, though unspectacular. However, as I discussed in Part 1 of this note. My analysis has led me to the conclusion that the global supply chain has been prioritizing current consumer goods at the expense of future consumer goods. That time transformation of capacity has been enabled by allowing the shipments of capital goods manufacturers to sit idle while shipment of Peloton bikes got first dibs on container capacity. Note that real manufacturing inventories have fallen more than they do during a typical recession and only just stopped falling in the first quarter (Charts 23 & 24).
Worse still, the industries experiencing inventory drawdown are the core industries of the manufacturing sector. Note that although motor vehicle manufacturers have been short on inventory, the inventory for larger transportation equipment (boats, trains, trucks, and planes) have swung around wildly over the past six years and are currently heading lower (Chart 25). Indeed, real manufacturing inventories are down across the production of key inputs and finished machinery (Chart 26).

The Big Squeeze
As mentioned above, the U.S. transportation equipment and machinery manufacturing industries play a vital role in global production. Many countries, such as Russia and China, have tremendous product manufacturing capacity but lack the capability to make the machines that make machines. Indeed, precision machine tooling has been described as Russia’s “soft underbelly”.
Given the importance the U.S. plays in this part of the global manufacturing sector, the developments in the GDP report were very disturbing from the point-of-view of future global potential growth. Note that investment in transportation equipment is way down, led by light trucks and SUVs (Charts 27, 28, & 29). Eventually this will become problematic as the light trucks currently in-use begin to wear out and require more and more maintenance to keep them on the road.
A similar situation is likely to develop in machinery manufacturing, where finished products in inventory has been plummeting because production cannot keep up with demand (Chart 30). The Fed’s Beige Book for February 2022 was filled with statements such as “Several contacts reported ongoing delays in the procurement of components and spare parts, particularly from China.” And “Firms continue to invest in process automation to address the systematic workforce shortage, with one manufacturing company in Arkansas tripling their number of robotic welders.” This writer’s concern is that the investment in automation will fall short of expectations due to a lack of parts.

Conclusion
Investors should take care not to see the oncoming slowdown as the end of the COVID story, but rather the end of the beginning of the inflation volatility story. The Fed is already showing signs of getting scared off of its tightening campaign with members talking about a “pause” in rate increases starting in September. Once economic momentum begins to build again inflation will quickly return when growth accelerates above whatever the disappointingly low potential growth rate of the U.S. economy is. As I’ve been discussing since early in the COVID crisis, with a smaller workforce and given the difficulty firms are having in completing labor-saving investments the potential growth rate of the U.S. economy is probably slightly below zero at present. That means “equilibrium” is stagflation and falling real wages while the Fed is busy “stimulating” the economy, and in the absence of stimulus the equilibrium is deflation and rising real wages. Neither is pleasant, but it can only be made worse by government efforts to avoid the painful reality. The obvious example of the 1970s and the folly of price controls to “fight” inflation looms large right now. Get ready for inflation surprises.
If you enjoyed this note, please do me the simple favor of clicking “Like” below, it helps immensely with search algorithms. Even better are subscriptions, 100% of the after-tax proceeds go to the care and feeding of my family.
Related Notes
“Inflation to Deflation Through Consumer Credit” of 16 April 2022
“U.S. Labor Market: Loaded for Inflation” of 4 April 2022
“U.S. Labor Market: Steeper Curves, Steeper Prices” of 11 December 2021
“Credit Cards: Inflation Acceleration Mechanism” of 3 December 2021
“Growth Cycles and Turning Points” of 30 March 2019
"Premium Plus" is what? Could not find a clear explanation on substack. Searches on document titles mentioned as references in substack posts come up empty with Duck-Duck-Go.