


Inflation Pressure Gathers Pace
The Inflation Train commeth

· Although the May CPI report beat expectations, to great fanfare, the apparent relief from inflation pressure is likely to provide cold comfort in coming months as underlying inflation pressure becomes apparent.
· The dramatic surge of transportation prices in 2024 is reminiscent of that observed in 2021 and is equivalent to the drawdown that occurs before a tsunami arrives.
Bottom Line: Using a broad array of indicators of inflation pressure provides some very concerning indications that the fight against inflation is far from won. If the FOMC were a non-partisan body, they would likely be preparing the market for a series of rate hikes to begin imminently. An internal rift between hawks and doves on the FOMC is likely to become increasingly apparent to the public as signs that inflation pressure is rising come into view.
The latest CPI report was labelled as being a “good” report by Chairman Powell and the media, while this writer would argue that such a label is only true to the extent it means “not bad” but no further. Worse yet, the CPI report sits at the very end of the inflation “pipeline” where goods and services are delivered to consumers. When we look further upstream, we see that the inflationary pressure this writer first noted in February has moved that much closer to appearing at the end of the pipeline. This note serves as an update on our upstream indicators of inflation.
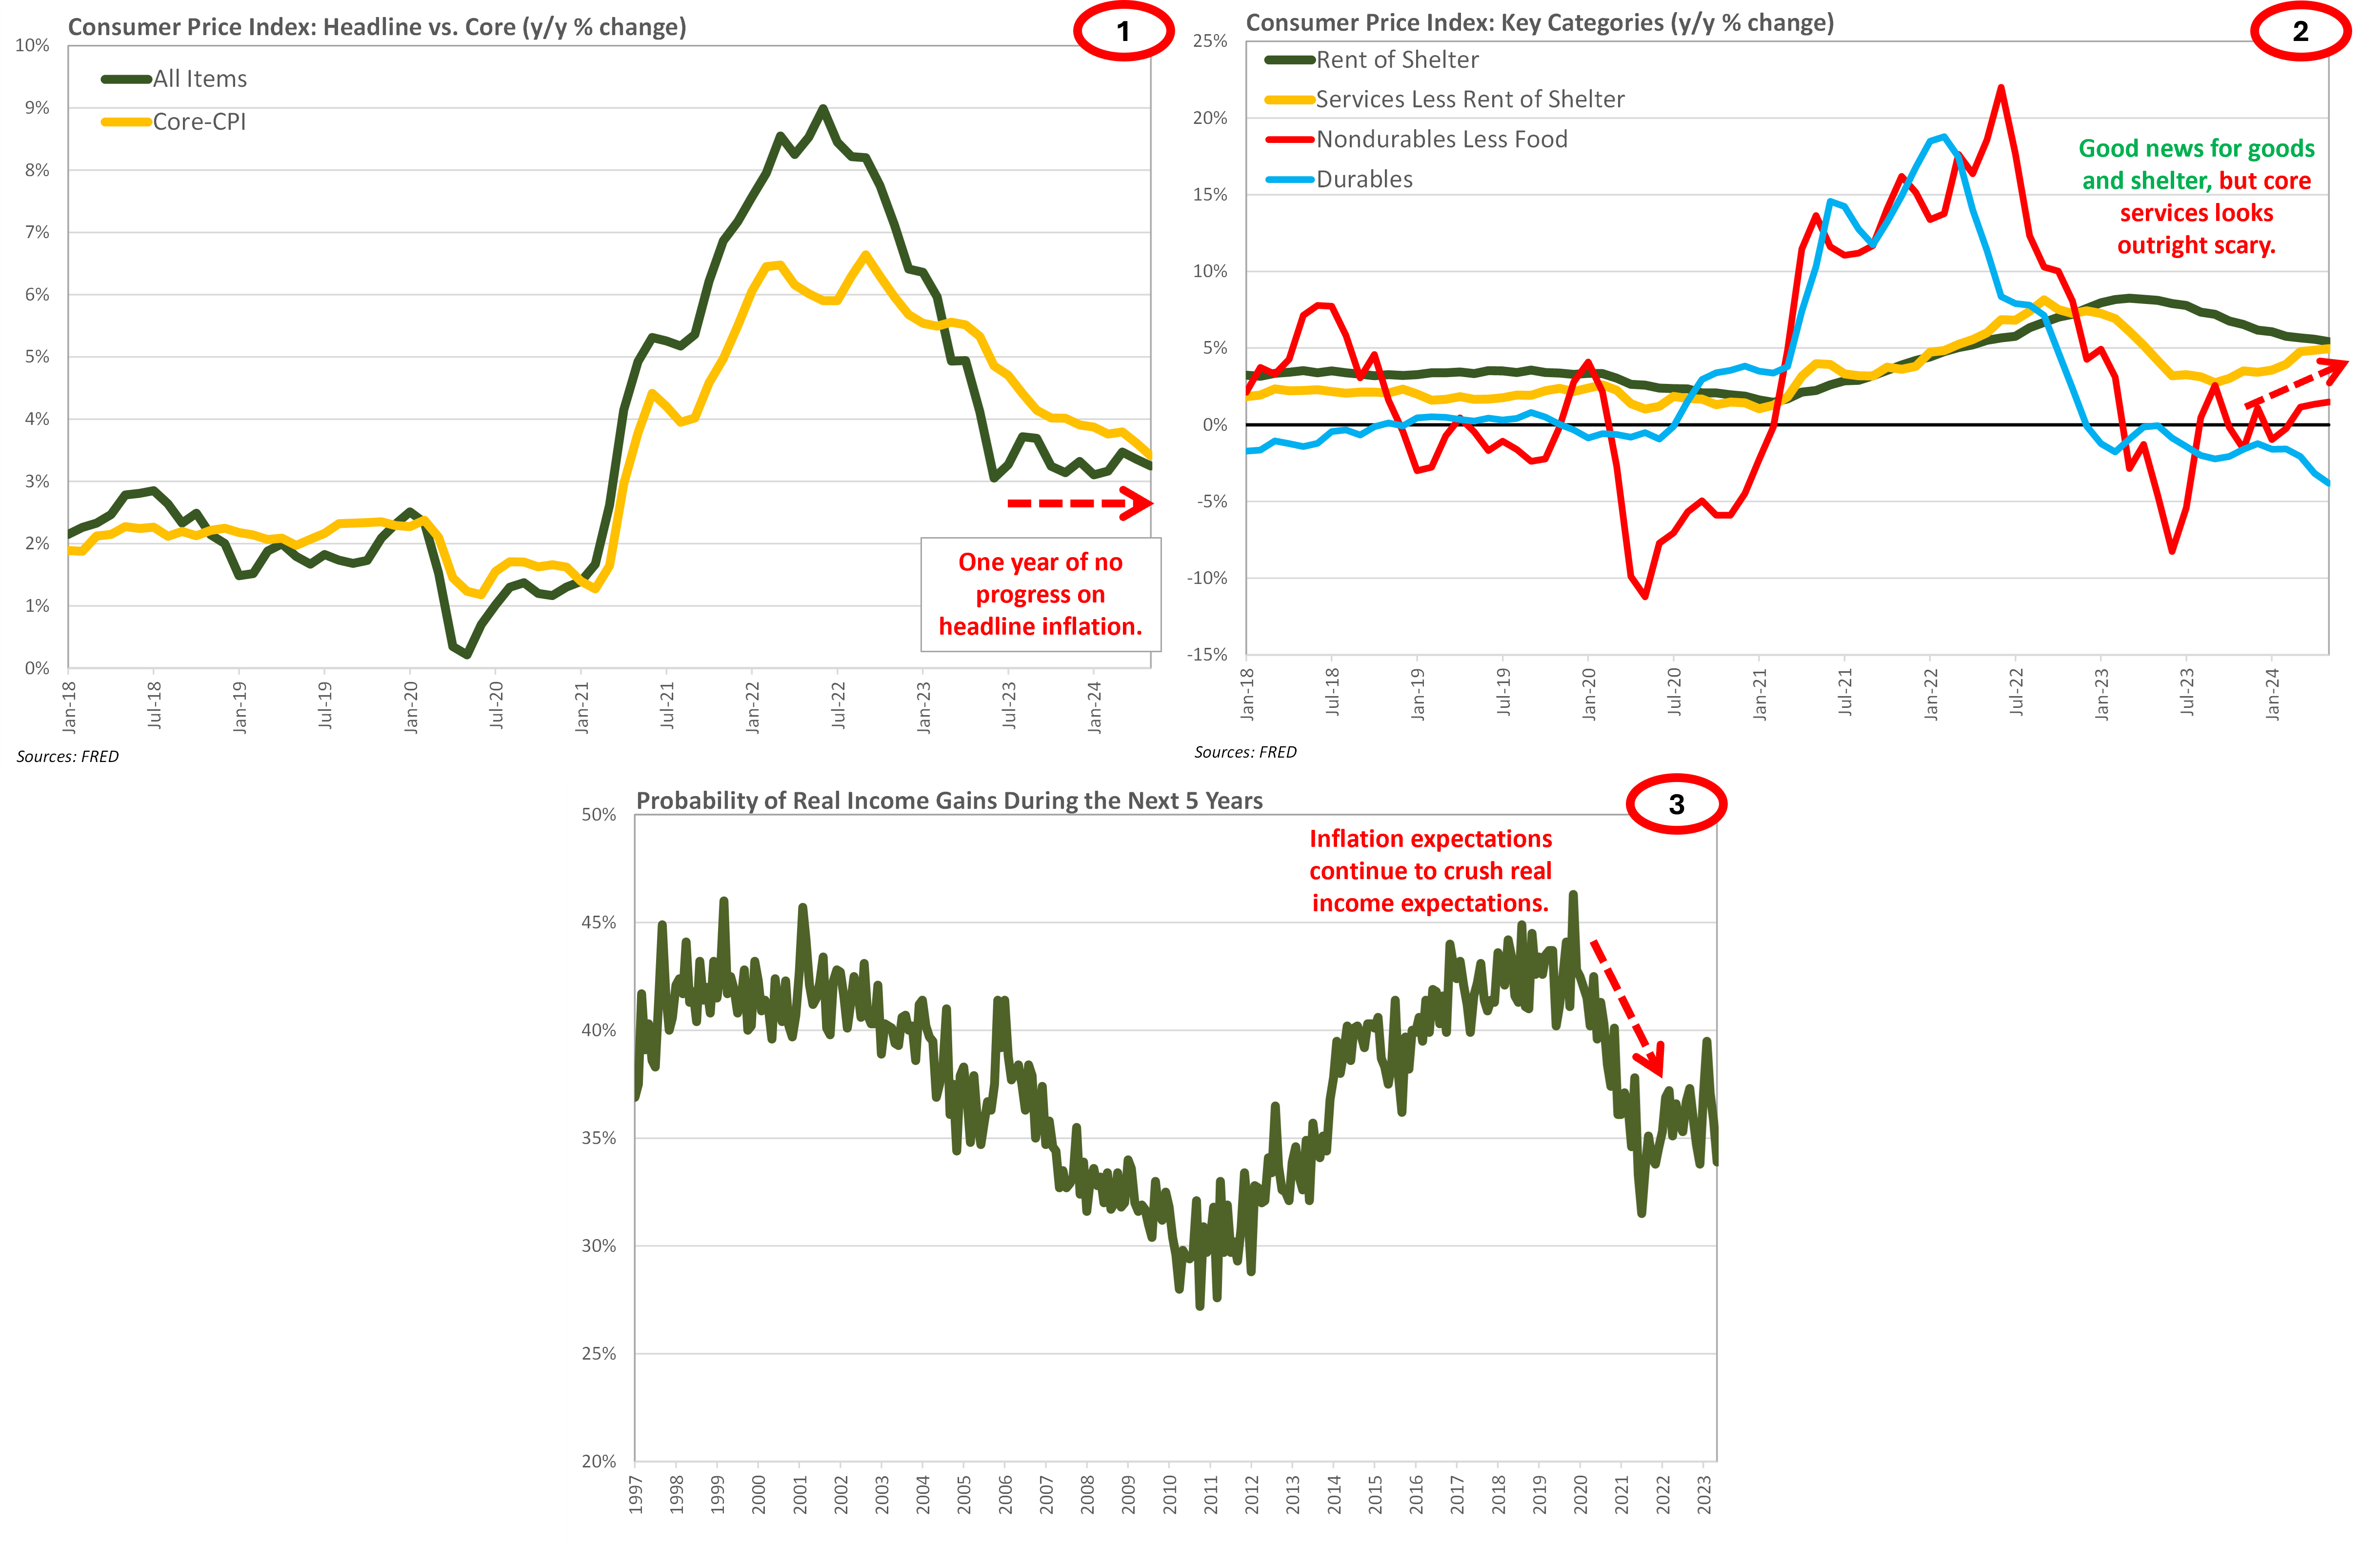
First, there is the price data coming right off the pipe, which leaves the doves precious little evidence that a rate cut would make any sense whatsoever. Core-CPI has continued to drift down, but headline CPI has seen no progress for one year (Chart 1). Drilling down into major categories, goods prices have been subdued and inflation from shelter expenses has been easing back (Chart 2). However, services excluding shelter costs continues to accelerate marking one year since bottoming. The price data is ambiguous at best, but once additional data is considered the situation looks outright disturbing.
At its heart, the long-run equilibrium level of inflation is largely a psychological reaction of the public to observed behavior of central bank and government officials. As defined by Claudio Borio at the BIS, a high-inflation equilibrium occurs when the political cost of reducing inflation is higher than the political establishment is willing to bear. In such a situation, monetary authorities accommodate inflation rather than suffering the consequences of higher unemployment. The most obvious indication that inflation expectations among the U.S. public are substantially and durably higher is the deflated expectation for real income gains, despite a very strong labor market (Chart 3).
Looking deeper at expectations, mean and median inflation expectations remain at levels last seen when oil was above $100/barrel (Chart 4). Importantly, elevated inflation expectations at the aggregate level are being driven by elevated expectations among households most sensitive to inflation (Chart 5). We interpret this data to mean that inflation expectations are currently much more sensitive at the high end than at the low end. There is a surprisingly high correlation between long-term inflation expectations and gasoline prices, which have risen to levels last seen prior to the oil price crash of 2014 (Chart 6). Households are primed to raise inflation expectations again if there is another wave of inflation in the economy, exactly as occurred during the 1970s.

One of Powell’s answers in the most-recent press conference warned that as soon as the Fed started cutting, financial conditions would ease substantially. That may well be the case, but Powell left unaddressed the reality that financial conditions are already loose and are getting looser (Chart 7). Aside from amalgamated indices of financial conditions, survey data is coming into line with the bullish state of the speculators’ spread. Consumers in the upper third of the income distribution have the most to gain from financial conditions being loose and these consumers are leading the way on sentiment improvement (Chart 8 & 9).

Doves in the commentariat have pointed to the downward trend of indicators of shelter inflation. Once again, this is mistaking price data coming from the end of the pipeline as an indicator of future inflation. The leading indicator in this case is an index of home prices, which is signaling a pickup in shelter inflation before the end of the year (Chart 10). More importantly, inflation is accelerating in the services excluding shelter category (Chart 11). This category is driven by wage growth, which bodes poorly for overall inflation performance. Note that surveys of pricing pressure in the services sector indicate a degree of normality, but inflation remains north of 2.5% (Chart 12). This could indicate that this higher level of inflation is now considered “normal” by survey participants.

Inflation pressure from the goods-producing side of the economy is frequently overlooked or discounted in importance because it represents a smaller portion of GDP than services. This approach is shortsighted because it misunderstands the uses and functions of economic indicators. Modern manufacturing is a useful indicator of economy-wide inflation pressures precisely because the sector is so efficient and, generally speaking, immune to short-lived price pressures. The upshot being that if inflation pressure is showing up in manufacturing, you can be sure there is inflation pressure throughout the economy.
Chemical manufacturing activity serves as a useful “second derivative” indicator for aggregate manufacturing activity because chemicals are necessary for almost all manufacturing processes and the ramp up for chemical manufacturing is much faster than it is for durable goods. By this measure, manufacturing activity is showing early signs of accelerating (Chart 13). If acceleration does occur, it will be starting from a place of elevated capital goods orders and a sizeable backlog already in place (Chart 14). Arguably, another surge in demand would run into capacity issues almost immediately and result in rising prices rather than expanding output (Chart 15).

Measures of inventory pressure indicate a sense of normality among businesses (Chart 16). However, as was the case with the service sector, reduced manufacturing inventory pressures have not been matched by a return to pre-pandemic average inflation rates (Chart 17). In the near term, the inventory portion of the supply chain looks unlikely to be a source of inflationary pressure (Chart 18). However, just over the horizon trouble lurks.

The dramatic surge of transportation prices in 2024 is reminiscent of that observed in 2021 and is equivalent to the drawdown that occurs before a tsunami arrives (Charts 19-21). As with the manufacturing sector it supports, the transportation sector is highly efficient and from the early 2000s until 2020 was largely immune to inflation pressures. The sudden sensitivity of transport prices to global conditions is a direct driver of inflation through transport expenses and inventory disruptions. More importantly, the simple fact that inflationary pressure exists in the transportation sector is a clear and unequivocal indication that capacity constraints and inflationary pressure are endemic across the economy.

Conclusion
Although the May CPI report beat expectations, to great fanfare, the apparent relief from inflation pressure is likely to provide cold comfort in coming months as underlying inflation pressure becomes apparent. The folly that the economic commentariat falls victim to is mistaking measured prices for inflationary pressure. Undoubtedly, developments in the former are the result of outcomes in the latter. However, as with all things, there is a lag between real world outcomes in the supply side and measurable effects occurring at the checkout line. Looking to measured prices at the end of the inflation prices for indications of future inflation is setting oneself up for a series of unpleasant surprises.
The FOMC is clearly aware of this, despite their insistence on using headline price indicators as the guideposts for communicating policy to the public. Using a broad array of indicators of inflation pressure provides some very concerning indications that the fight against inflation is far from won, as was made clear in this note. Indeed, if the FOMC were a non-partisan body they would likely be preparing the market for a series of rate hikes to begin imminently. Instead, the committee suffers from feet of clay as partisan doves fight to keep rate hikes off the table in an election year. Meanwhile, the fires of inflation continue to burn hotter and hotter, a fact that will become increasingly obvious in the data as the second half of the year progresses.