


The Fed Loses Its Grip
Some curves matter more than others

The ongoing debate over whether the U.S. is currently in a recession or not highlights the problems inherent in using economic statistics as “signals” devoid of any causal relationships. Treating the yield curve as a signal, rather than as a causal factor leaves “forecasters” vulnerable to erroneous conclusions. Indeed, we believe expectations for an imminent recession based solely on the shape of the yield curve are incorrect. This note examines the current state of the U.S. yield curve and discusses reasons why a recession might not be in the cards without further action by the Fed.
A Badly Mangled Curve
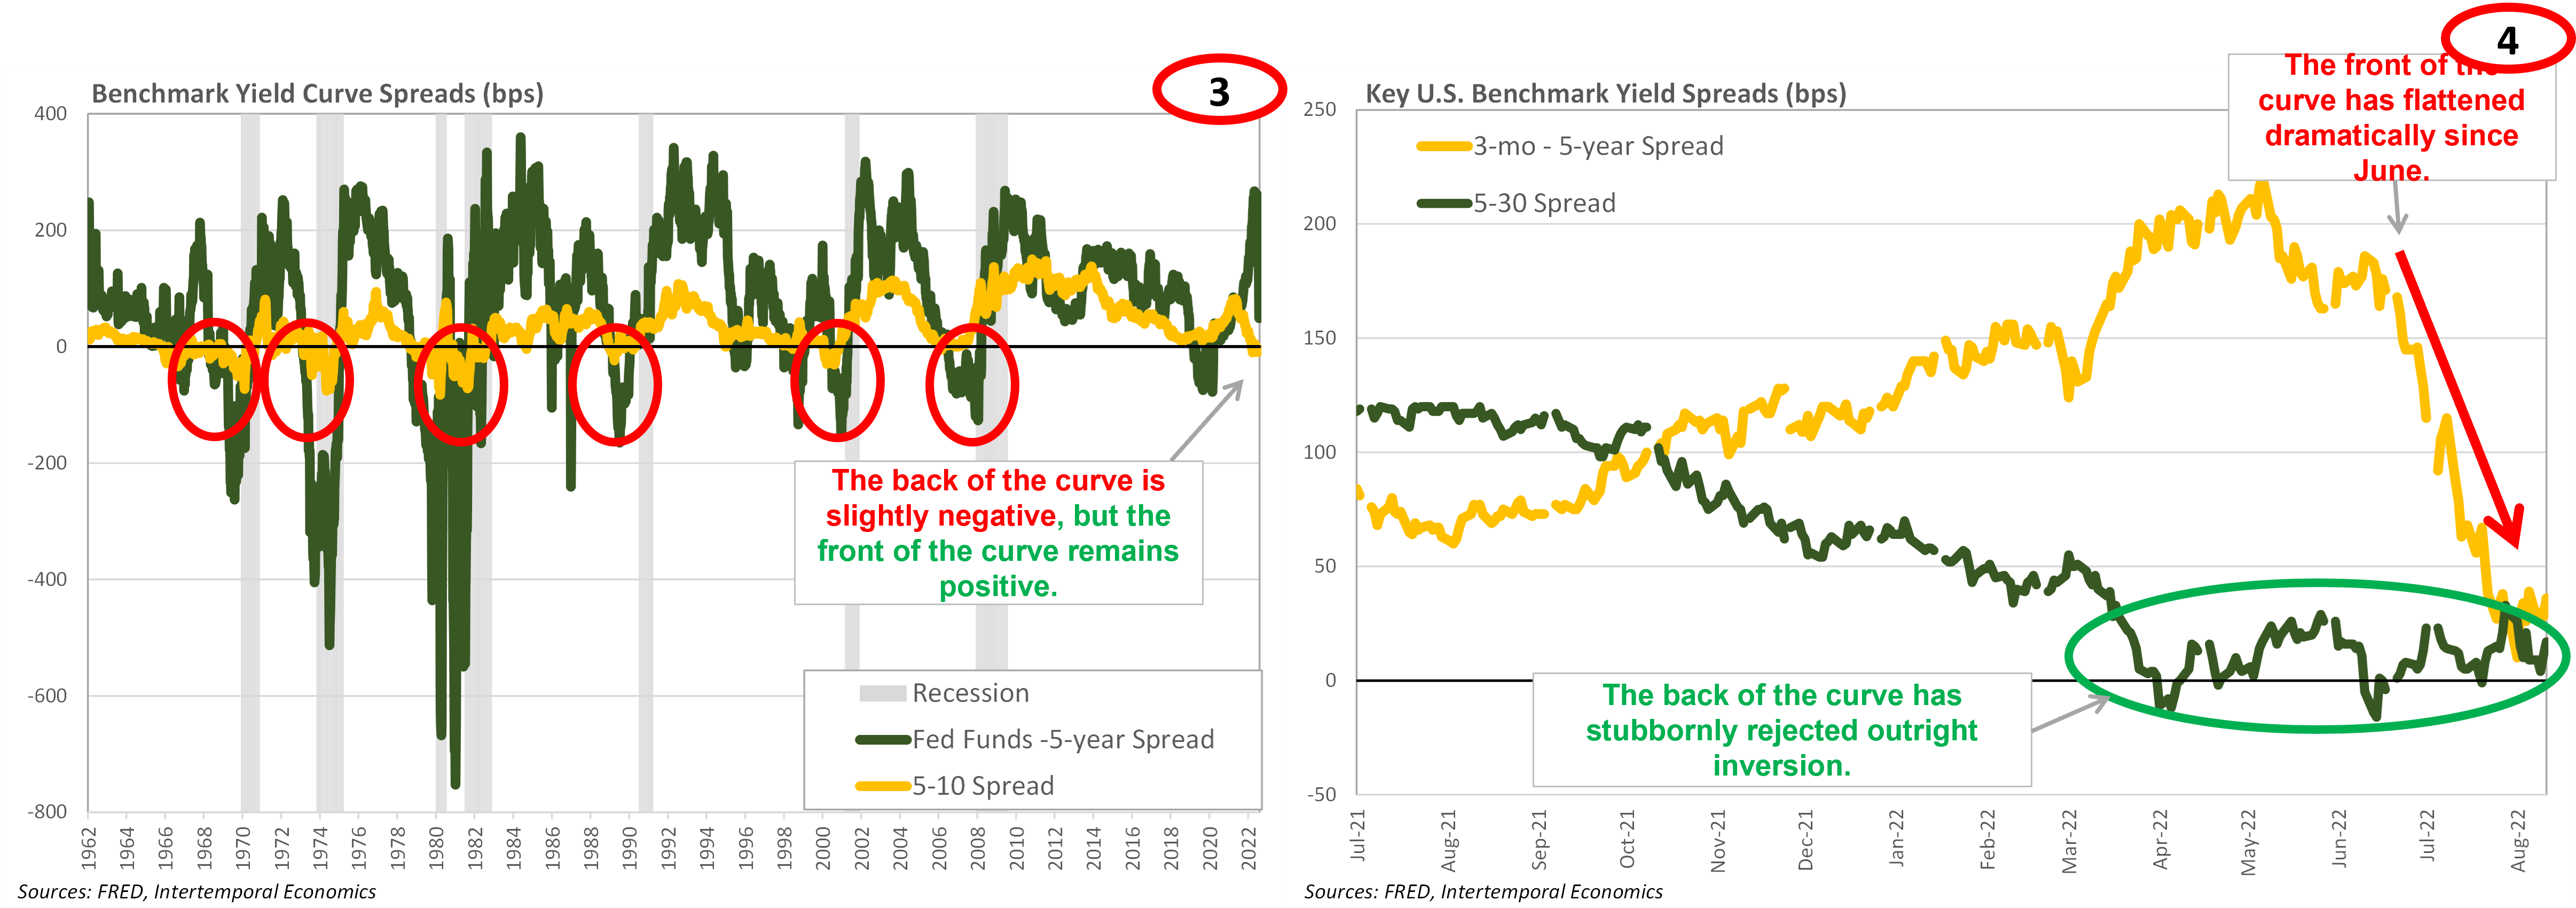
The first sign that information coming from the yield curve could be a bit garbled is its badly distorted shape, reflecting the pushing and pulling effects of forward guidance and asset sales (Chart 1). The curve has flattened as short-term rates rise along with the fed funds rate, but limitations on the max rate of bond sales are keeping a lid on the back end of the curve. The result has been that the market-standard measure for recession warning, the spread between the 2-year and 10-year Treasury bonds, is deeply negative while the less-watching but more accurate 5-30 spread has been stubbornly positive (Chart 2). Without causality examining these seemingly contradictory signals become a guessing game rather than an exercise in economic analysis.

Once we incorporate cause and effect, rather than simply looking for “signals”, the situation becomes much clearer. Much emphasis is placed on the middle of the yield curve by the standard 2-10 spread measure. Looking at the scope of post-WW2 recessions shows that the yield curve only served as a reliable leading indicator when the entire curve was downward sloping (Chart 3). The reason, of course is that the yield curve is not simply a mechanism for measuring the likelihood of recession but rather the price for borrowing money at different maturities. For leveraged lenders, who borrow money to relend it at a higher rate, the spread between short maturities and long maturities is the reward offered for taking the risk of maturity transformation. An inverted yield curve means the profit for leveraged lending is negative, so risky lending is curtailed and economic activity declines resulting in a recession.
The bad news is that the front end of the yield curve has been plunging downward as the Fed has tightened policy over the past few months. The good news is that across its length the yield curve is upward sloping, although just barely (Chart 4). That means there is still a small reward available for leveraged lenders who borrow short-term at the market rate and lend long-term. The hitch for the Fed is that the monetary system in operation today is not the same monetary system the Fed worked with prior to 2008. The switch to an “ample reserves” regime has inflationary implications the Fed might find surprisingly unpleasant.
New Regime Implications
Prior to 2008, banks kept very little cash on their balance sheets and the Fed operated a “scarce reserves” monetary policy regime (Charts 5 & 6). Under such a regime, the Fed required banks to keep a minimum level of cash on hand and disincentivized keeping anything more than the minimum. By incentivizing banks to keep only the minimum of cash on hand the Fed could easily adjust interest rates by making only small changes to the supply of cash available to banks. However, after 2008 the Fed’s asset purchases made it necessary to switch to an “ample reserves” regime where banks keep huge amounts of cash on their balance sheet. Under this type of regime there are no binding requirements, and the Fed only uses incentives to influence the price of credit.

Under the scarce reserves regime banks relied heavily on interbank and other types of market rate borrowing to fund their loan books (Chart 7). That process accelerated in the late 1990s and immediately prior to the financial crisis of 2008 banks were funding nearly 30% of their loans and leases with market rate “wholesale” funding. However, deposit creation and the change in monetary regime have flipped that situation on its head such that commercial banks hold $1.40 worth of deposits for every $1 of loans and leases on their books. Banks currently have a very stable funding situation and that has competitive implications.
As readers are likely painfully aware, interest rates on retail deposits are almost universally less than ten basis points and show no signs of changing. Indeed, prior to the COVID shock rates had not reacted to changes in Fed policy and there is no reason to expect that dynamic has changed. That has important implications for banks, which are funded with nearly-cost free deposits. Banks are benefiting from rising loan rates and stable funding rates, which cannot be said for their leveraged competitors (Chart 8).

Banks Keep The Party Going
A flattening yield curve and rising risk aversion have cut off the supply of funding for risky assets since the start of 2022. The market has almost completely dried up for equity IPOs and high yield bonds as leveraged speculators pulled back their demand when the rewards of maturity transformation disappeared (Charts 9 & 10). In contrast, banks built up a huge pile of cash and have been putting it to work recently. The Fed may find to its dismay that a rising fed funds rate merely clears the competitive landscape for commercial banks rather than tightening financial conditions. Banks have shown no signs of slowing down their commercial lending operations, which are reported weekly (Charts 11 & 12).


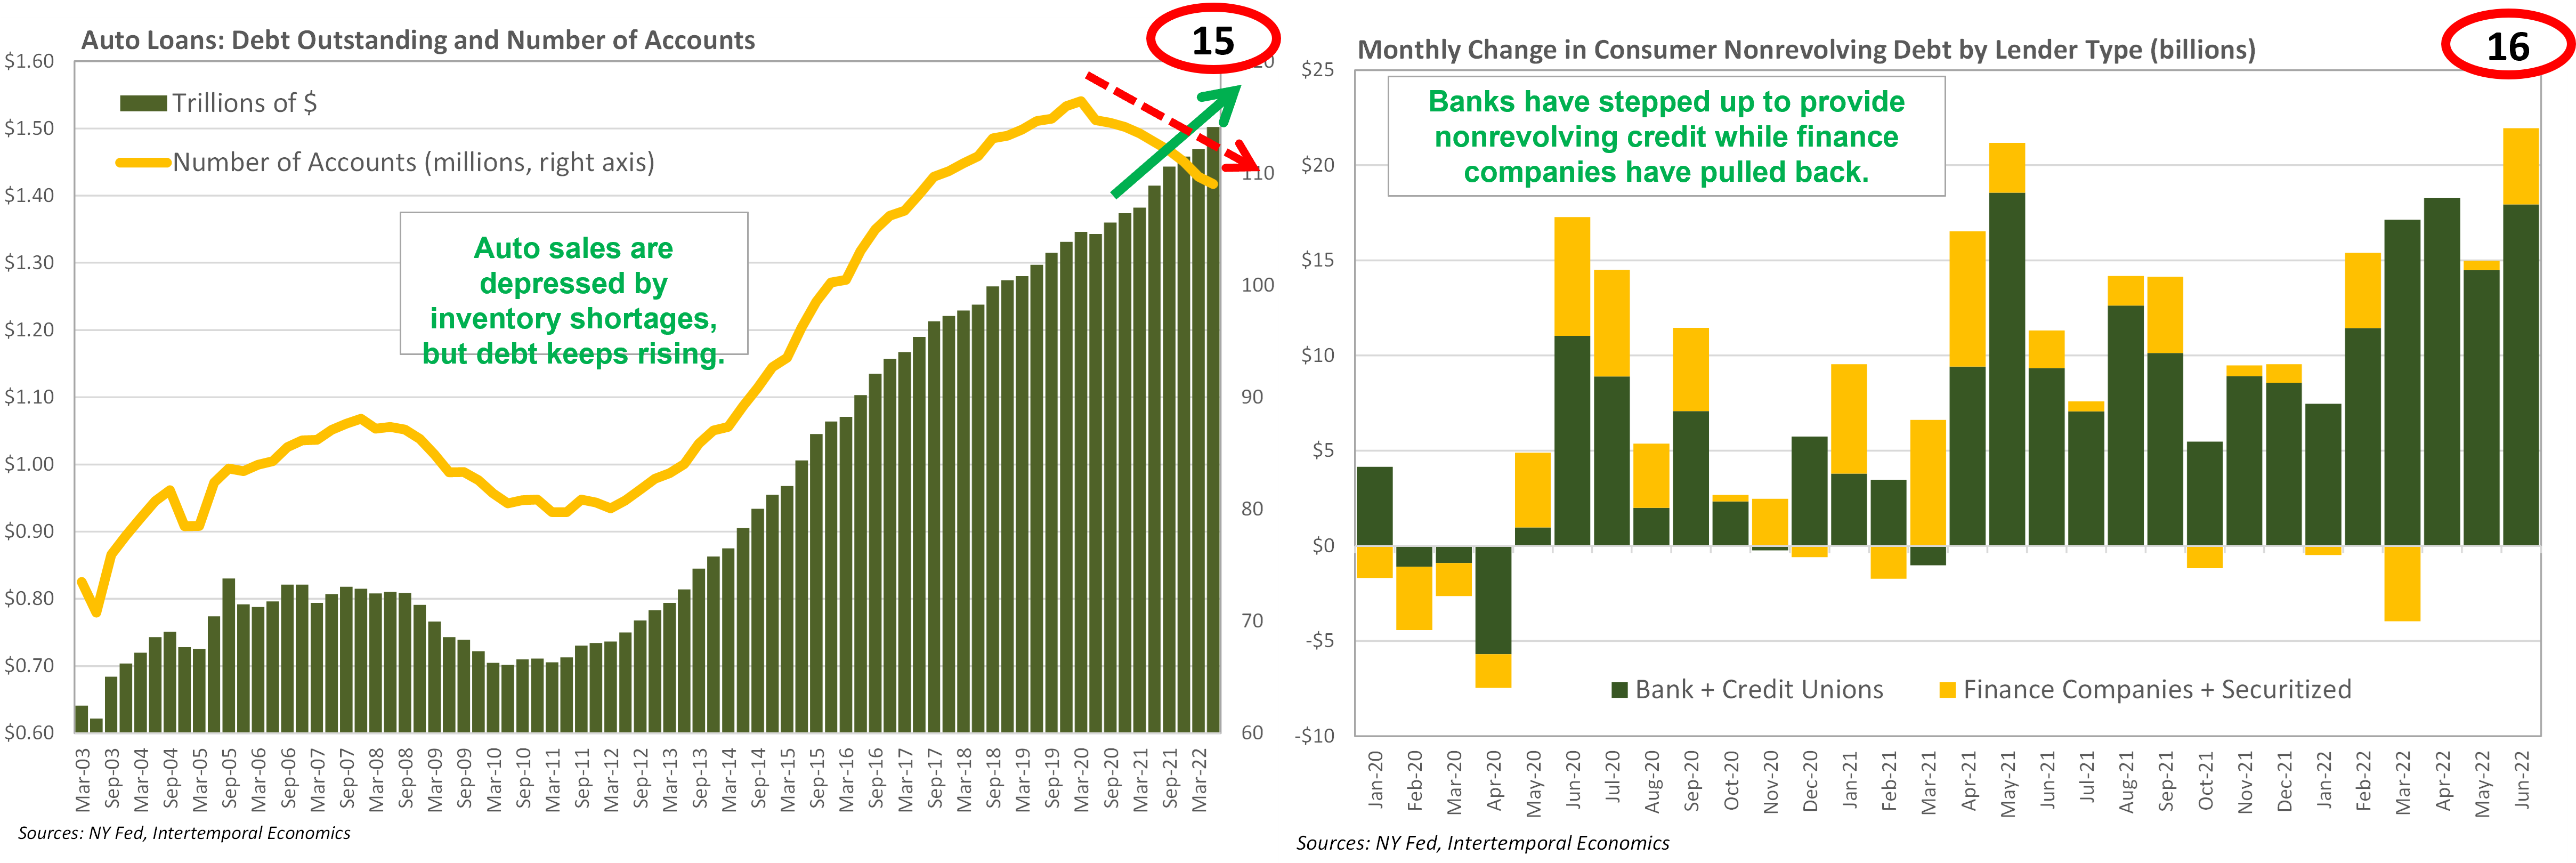
Banks have also shown willingness to lend to households, which have been ramping up their credit card borrowing and opening new accounts in recent quarters (Chart 13). Despite an increase in credit card balances of nearly $150 billion since Q1 2021, U.S. consumers are near record low utilization rates on their lines of credit (Chart 14). Households can comfortably put another $200-300 billion on card balances before getting back to pre-COVID leverage levels. The situation in auto lending is more complex, as supply constraints have been limiting the number of vehicle sales. However, buyers able to secure a vehicle are paying such high prices that outstanding debt continues to rise even as the number of borrowers falls steadily (Chart 15). Banks have stepped up to provide the credit for vehicle purchases while leveraged finance companies have had to pull back as the result of rising funding costs (Chart 16).

Conclusion
The Fed, and equity market participants, are counting on a rising fed funds rate to slow economic activity and bring down inflation. That was a reliable assumption prior to 2008, when banks were heavily dependent on market-rate borrowing to fund their loan book. There are clear signs that the flattening yield curve has curtailed leveraged lending activities as the market for risky assets has almost entirely dried up. But it remains to be seen whether bank lending will increase to fill in the gap left by leveraged lenders. Under the Fed’s monetary policy regime of ample reserves banks have funded their loan books entirely with retail deposits, which yield less then ten basis points at present. As a result, banks are well-positioned to benefit from the demand for credit that remains in a high-pressure economy. For the economy to slow down there must be a slowdown in credit creation. Without firm control over the funding curve for banks, the Fed has ceded some control over monetary policy to the risk committees of banks. We expect the Fed to be surprised by the lack of a recession in late 2022 and for the issue of inflation to become pressing again in 2023.
Please like, comment, and subscribe if you enjoyed this note as each of those actions puts a little “gas” in the tank here at Intertemporal Economics. Just clicking like is immensely helpful and is an important source of emotional compensation for writing these notes.
Related Notes
The Fed and YCC: In Everything But Name
Growth Cycles and Turning Points