The Fed, the Yield Curve, and Credit Creation
Don’t get burned at the short end of the curve my friends.
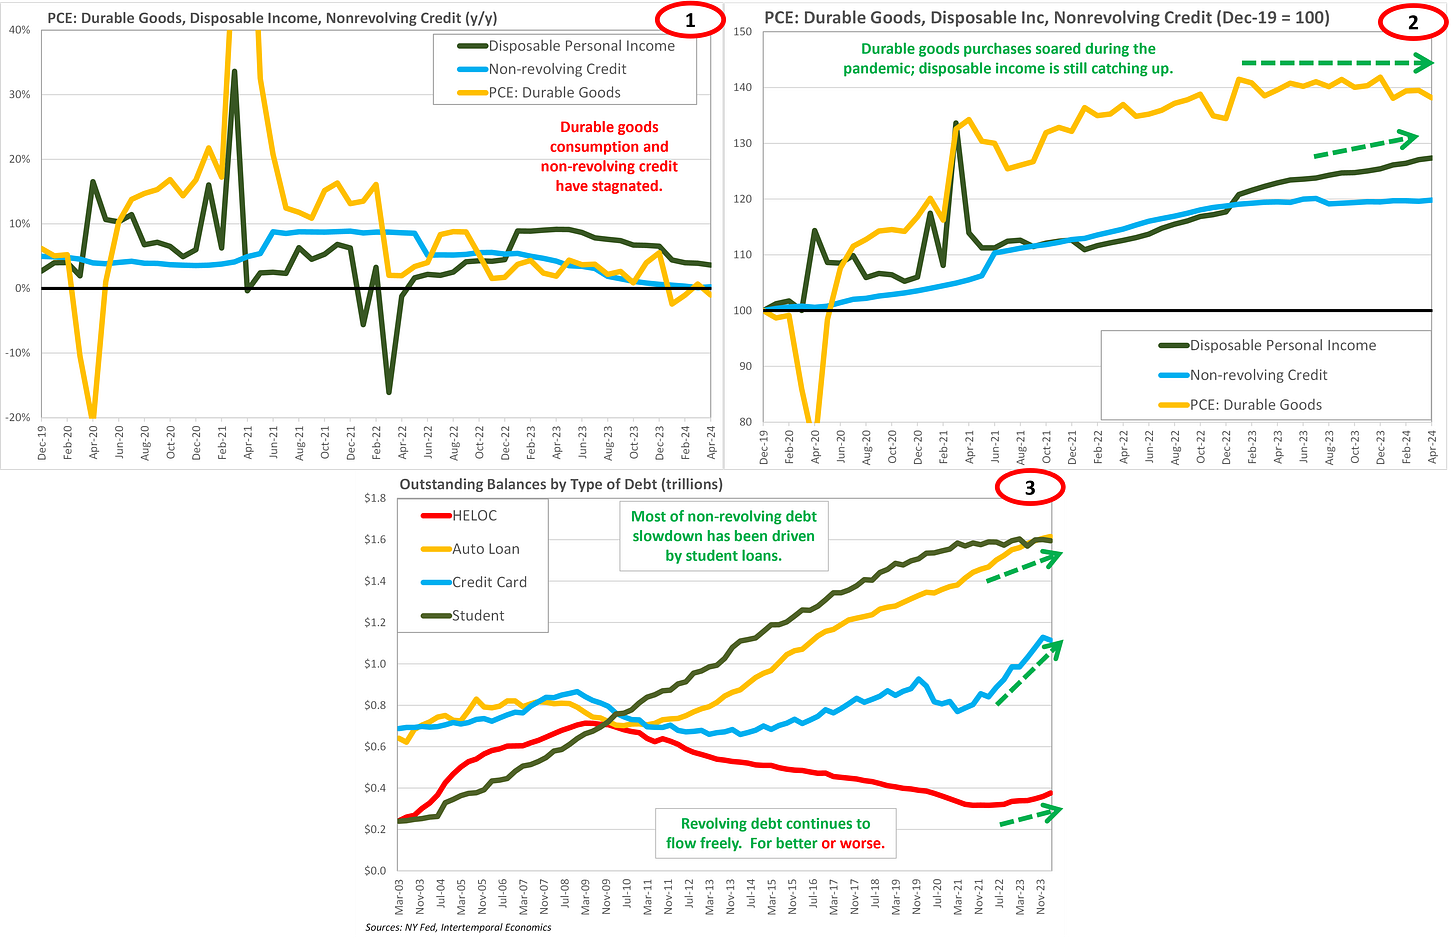
Much has been made recently by bearish commentators about supposed signals from a variety of “recession indicators”. The indicators, such as the so-called “Sahm Rule”, generally fall victim to the propter hoc fallacy in that they are temporally associated with recessions but provide no causal link to economic conditions. As the traditional indicators have failed one by one the commentariat has successively moved further and further down their list of statistically derived “indicators”. Most recently the slowdown in durable goods consumption growth and an associated slowdown in nonrevolving debt growth have been the indicator of choice for economic fortune tellers (Chart 1). This note will examine the situation in credit markets to search for signs of the dramatic and imminent slowdown bears are forecasting.
The most obvious counterpoint to the recession argument is that durable goods consumption significantly outpaced disposable income growth during the pandemic and the current slowdown is benign and necessary (Chart 2). Furthermore, most of the slowdown in nonrevolving debt growth has been driven by the top in student loan debt that began in early 2021 (Chart 3). Debt for auto loans, and revolving debt in general, continued growing during and after the Fed’s tightening campaign.
Leverage for households is limited by their ability to service debt rather than some abstract concept of risk management, which boils down to disposable income growth. Disposable income outpaced headline income in 2023 as tax payments fell along with capital gains from home sales. However, in 2024 the two measures have equalized in line with historical precedent (Chart 4). Taking a longer view, disposable income growth is showing signs of a secular trend uptrend similar to the 1960s and 1970s (Chart 5). A period of generalized accelerating nominal wage growth fits with conditions in the U.S. labor market.
The upshot is that households with rapidly rising nominal incomes will benefit from a mechanical reduction of leverage and could take on additional debt as a result. Despite strong nominal wage growth, the household sector’s real income growth is simply not keeping pace with pre-pandemic growth rates (Chart 6). Pressure on real income growth has arguably been driving households to take on additional debt to defend their standard of living, which is defined in real terms.
Indeed, the household savings rate has fallen three percentage points since 2019 to an abysmal 4% (Chart 7). If financial conditions were as tight as the Fed and bearish commentators claim, then this additional leverage would not be possible. For better or worse, the banking sector stands ready, willing, and able to extend credit, as indicated by the Chicago Fed’s financial conditions index (Chart 8). According to this index, and others like it, financial conditions are as loose as they were in 2019 or 2021 and getting looser on a weekly basis. Of course, wanting credit and being granted credit are not the same thing, nor are banks in business to maintain social harmony by subsidizing middle class lifestyles. Case in point is household consumption of new vehicles, which remains elevated despite a two-million-unit reduction in cars sold between 2019 and now (Chart 9). The obvious conclusion is that the new vehicle market consists of a smaller group of people buying more expensive cars than was the case pre-pandemic.
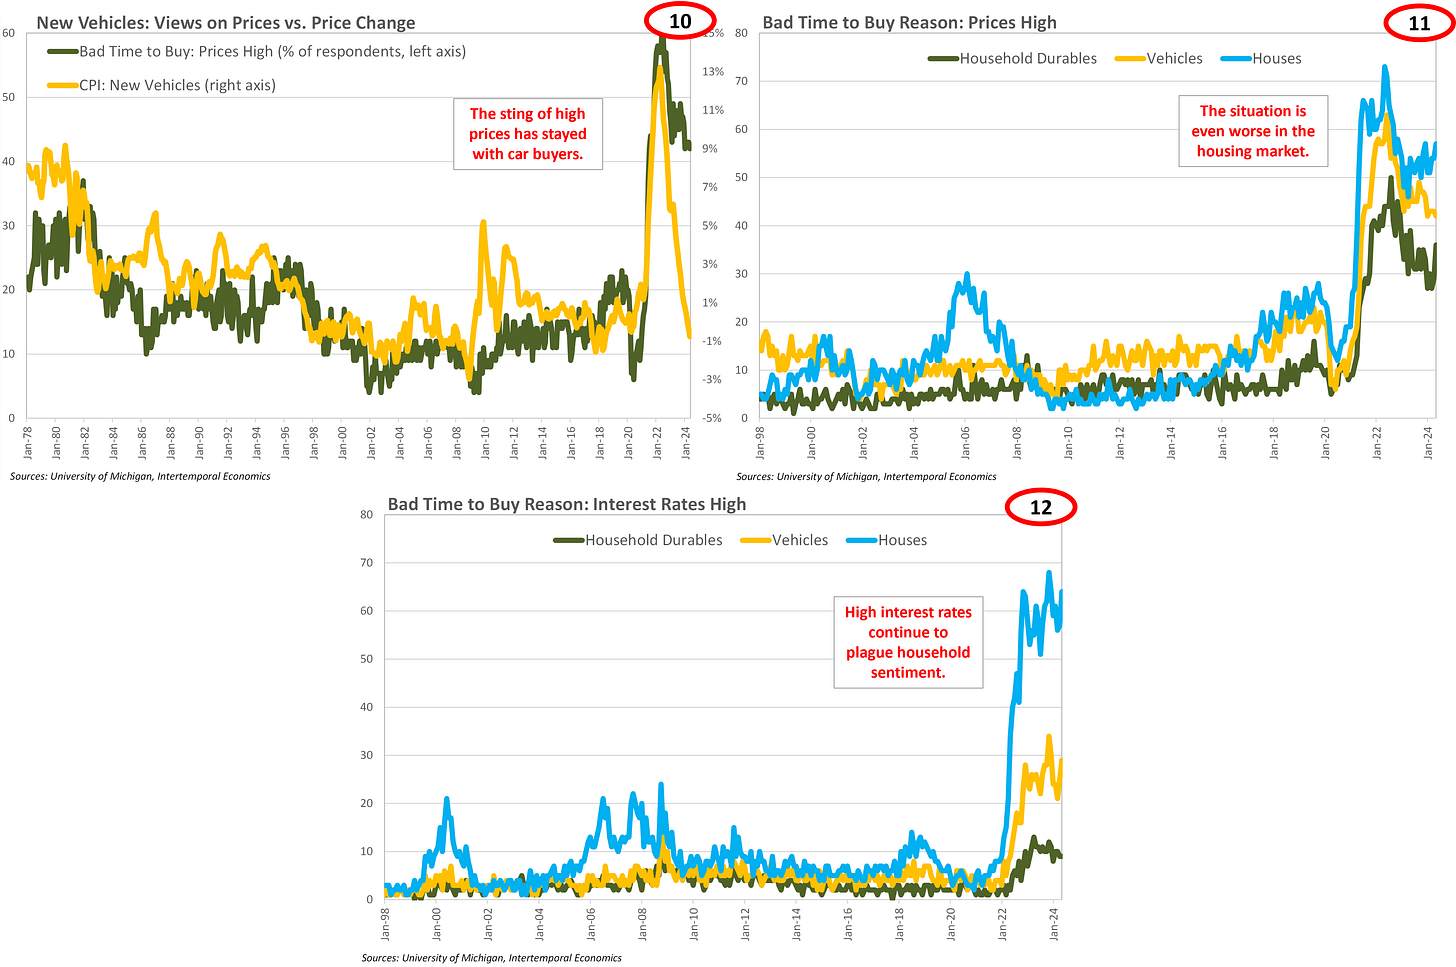
There is no denying that the household sector is feeling pain from the dual pressure of higher prices and higher interest rates, as clearly shown by the University of Michigan survey (Charts 10-12). The question economic commentators should be addressing is not “When will a recession occur?”, but rather “Why has one not already occurred and will those conditions change?” The difference between those questions is defined by the value of the answers and encapsulates the benefits of using an Austrian framework rather than relying on statistical analysis.
One indicator that gives this writer pause is the ex-ante real fed funds rate, which is as high now as it was in the leadup to the 2008 financial crisis (Chart 13). The yield curve overall is inverted, and the back end of the curve is flat, which has been a harbinger of recession in the past (Chart 14). However, neither of these indicators provides a causal link between financial conditions and economic conditions.
The inverted yield curve does not foretell a recession, but rather is the cause of recession. Leveraged lenders borrow at the front end of the curve, lend at the back end and live on the spread. An inverted yield curve makes this arbitrage unprofitable, encouraging credit arbitrage by borrowing at the AAA rate and lending to subprime borrowers. Banks are the most extreme version of this business model with funding occurring on an overnight basis in the form of customer deposits and reserves (Chart 15).
Looking to the banking sector’s yield curve, the reason for such loose financial conditions immediately becomes apparent (Chart 16). As this writer has discussed previously, the Fed is still learning to operate monetary policy in an ample reserves environment and policy is not as tight as they think it is. Deposit rates paid out by banks are a fraction of the prime rate charged to customers and, therefore, lending to the household sector is a very profitable enterprise right now.
The worry for the Fed, as highlighted at the June press conference, is that a premature Fed funds rate cut will trigger significant loosening of financial conditions. Of course, a quarter point cut at the front of the yield curve would hardly move the needle on its own. Much more important, with unemployment at 4%, is the signal a rate cut would send to market participants and the subsequent effect on the long end of the yield curve. A significant decline in yields at the long end would be a soothing balm for bank balance sheets (Chart 17), likely encouraging lending. Indeed, the period since the 2008 financial crisis has been one of continual leverage reduction by the household sector (Chart 18). The Federal government has thus far plugged the hole in final demand by heavily leveraging the public balance sheet (Chart 19). If the Treasury market were to fall apart because of concerns about the sustainability of the government’s fiscal position, then either deflation or hyperinflation are possible depending on the Fed’s reaction. A much more likely scenario is a household sector re-leveraging. The inflationary implications of which loom large over every decision the Fed makes right now.
There is good reason to question whether the government’s leverage would have been able to reach such heights without some degree of financial repression by the central bank. A strong argument for repression can be made by pointing to household net worth in the years since 2011 (Chart 20). Household assets exploded upwards in value, more than counteracting the effects of deleveraging. The reason for the increase in value was not a dramatic improvement in the rate of return on capital, but rather the repression of interest rates below expected rates of return on capital. By holding market interest rates below the expected rate of return on capital the central bank drives the desired stock of capital to infinity. The result is the initiation of many capital investments that will ultimately prove unprofitable in real terms and capital gains to owners of existing capital.
Even if we assume the social pressures caused by inflation were not a threat to the existing order, the ongoing and accelerating redistribution of wealth upwards will become increasingly difficult for the Fed to ignore (Chart 21). The pandemic housing boom almost exclusively benefited wealthy homeowners with high credit scores. Via refinancing, these people were able to extract over $250 billion from their homes in cash as well as save billions in interest payments over the life of their loan (Charts 22-23). Day by day the Fed guides the U.S. economy along a path that ends with Karl Marx’s being proven right in his predictions about the vulnerabilities of the capitalist order, as discussed masterfully in Bernard Connolly’s recent book.
Conclusion
The household sector is undoubtedly feeling the pain of higher price levels and higher real interest rates. However, the labor market remains very tight and disposable income continues to rise at a respectable pace. Meanwhile, the mechanics of post-2008 monetary policy have resulted in financial markets being looser than the FOMC realizes and a banking sector hungry to lend. If the Federal government suddenly begins a deleveraging campaign, then a re-leveraging by the household sector will keep the economic wheels from falling off. Such an outcome seems unlikely with either a Trump or a Biden administration in office. As a result, any increase in household consumption fueled by credit expansion is likely to be highly inflationary.
Even without a generalized leveraging by the household sector, financial repression by the Fed will have consequences. As discussed briefly in this note and discussed frequently and at length by Bernard, maintaining a market rate of interest below the average rate of return on investment (the Hayekian natural rate) inevitably leads to asset bubbles. These bubbles heavily favor current asset holders and therefore result in a redistribution of wealth upwards. Such a situation cannot persist forever, eventually social strain reaches a breaking point.


