


The Weekly Beat: 18 May 2022
Interest rates, Stocks to Watch, and More...

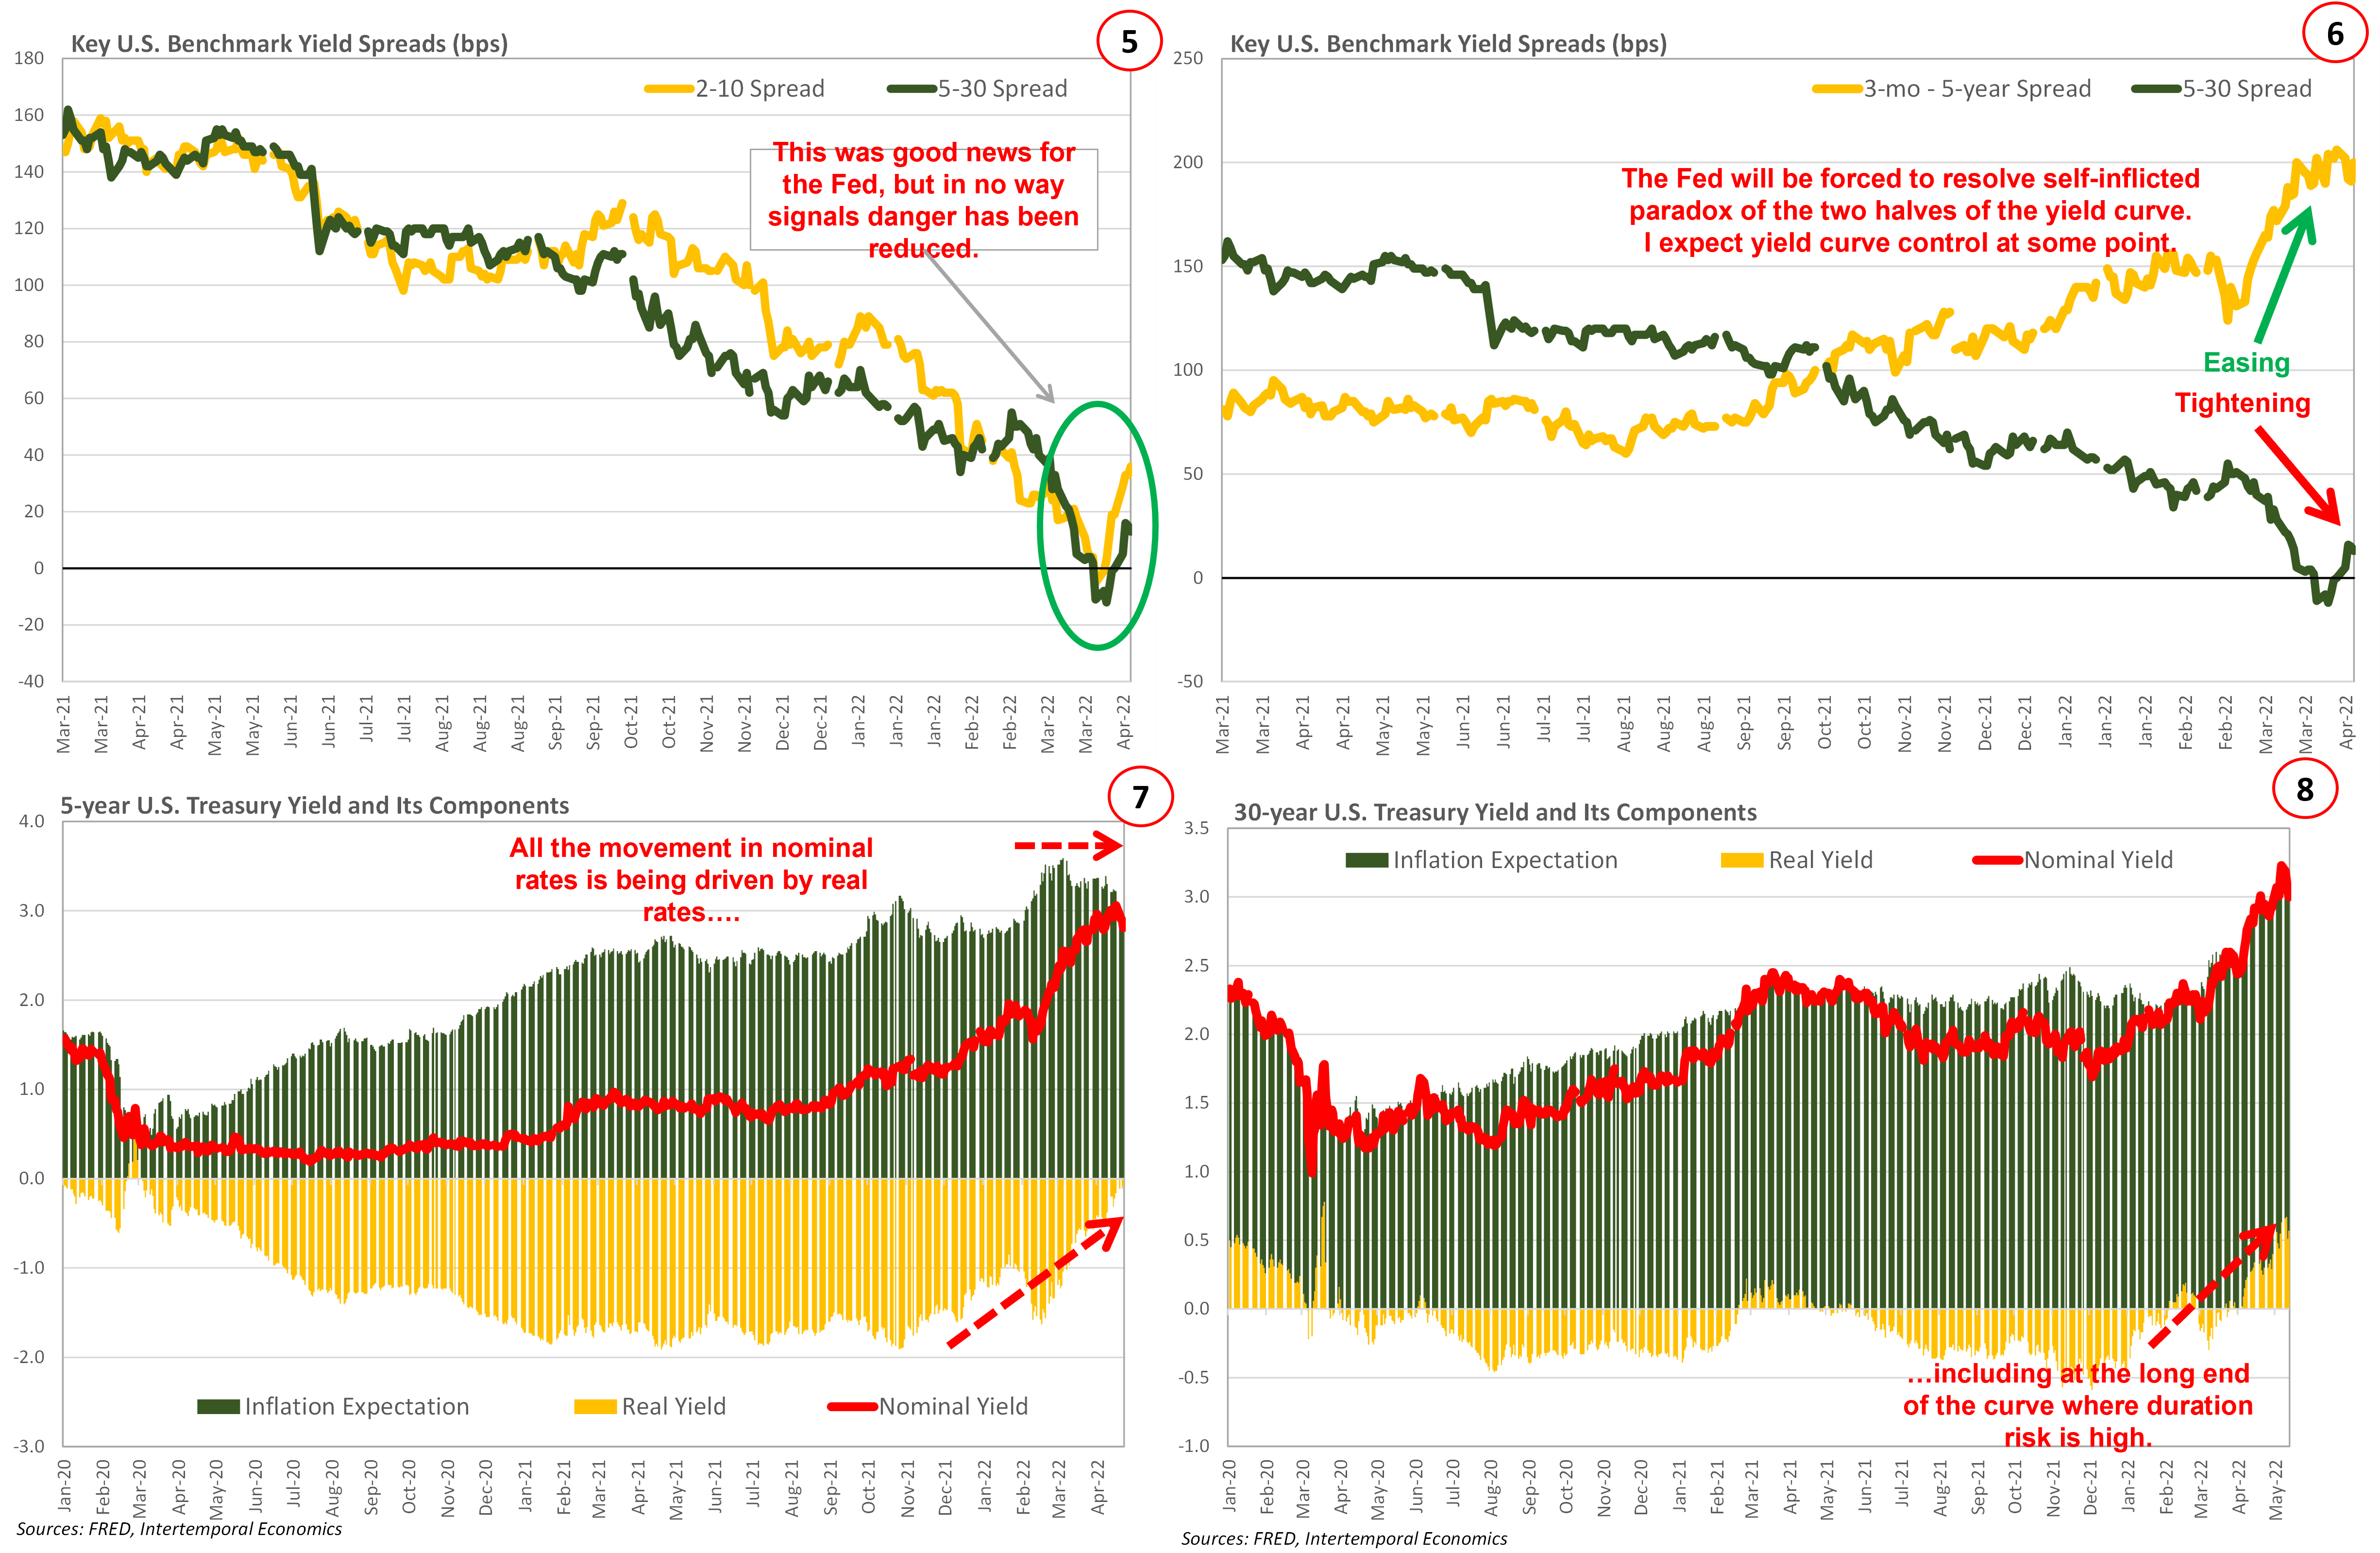
· The Fed’s confidence in its ability to make everyone’s dreams come true is not reflected in yield curve developments and the ongoing decline in equity markets signals investors do not share the Fed’s optimism. The first indication that the Fed is going to have a tougher time than it expects is the clear impetus to “pivot” observed in the yield curve. Policy action has pushed short-term rates up, but long-term rates keep slumping back down (Chart 1). The bad news for the Fed is that the flattening is happening in real yields, where actual resources are allocated, rather than simply in the market for inflation expectations (Chart 2).
· The Fed has created a difficult situation for itself by kicking off a taper tantrum in the middle of the curve, right at the meeting point between consumption and investment. The steepening of the front of the yield curve is highly stimulative to consumer lending, where expected payoffs on loans tend to be less than five years. In contrast, in the world of capital goods the lending tends to target long maturities of over twenty years and funding comes from short-term bond markets with maturities in the two- to five-year range. The flattening of the long end of the curve has been acting as a break on investment while the steepening of the short end of the curve has stimulated consumption (Charts 3 & 4).
· Market commentators have focused on the reversal of the curve inversion that took place at the long end of the curve last month (Chart 5). Many see this as an “all clear” sign of recession and began worrying about more inflation. There is good reason to worry about inflation, given the steepening of the front end of the curve. But, at the end of the day, the dilemma of the two-faced yield curve will need to be resolved by seriously tightening policy and inverting the entire yield curve (Chart 6). How long it takes the Fed to figure that reality out will determine how many up/down cycles in growth and inflation we are likely to have in rapid succession with increasing volatility.
· There should be no doubt that serious tightening has been taking place in the investment side of the economy, as the movement in nominal rates has been driven by a sustained move upwards in real rates (Charts 7 & 8). Financial conditions have tightened significantly over the past two months, and the problem appears to be driven by a shortage of liquidity in international dollar markets – as evidenced by the appreciation of the dollar against advanced economy currencies (Charts 9 & 10). However, we have by no means reached “the big one”, yet. That much should be made obvious by the tightness of corporate credit spreads (Charts 11 & 12). Investors are worried that the party might be over, but they have not yet spooked and run for the exits.
· That might seem self-evident, but as will be discussed below, it is an important point to consider when examining recent stock market performance. The sell-off in May has been sharp, but it has been orderly, which means it is too early to go looking for deals, if a company looks weak now just wait until things hit the fan. Concerns about consumer price volatility and bond market liquidity are driving the change in position in this week’s Stocks to Watch.
Stocks to Watch: ABBV, GILD, PBR, K, SFL, CPB, DOW, GIS, WMB


Equity Markets
· The equity market selloff has investors on edge, but it is worth noting how orderly the decline in the S&P 500 has been over the past month (Chart 13). Indeed, the selloff is a sharper version of the decline in markets that played out from January to March earlier this year. Note that in the ride down from 4600 to 3900 the RSI never dropped below thirty. The indicators are signaling a change in expectations, rather than a change in sentiment.
· Another indication that the declines are orderly, and therefore unlikely to reverse soon, is the wide dispersion of performance across equity markets and sectors. First, small caps began selling off back in November 2021 and tech stocks started selling off in early January 2022 (Chart 14). That implies pressure on companies expected to navigate cost pressures to continue making money and pressure on companies valued based on future expectations about buyout value with much less emphasis placed on near-term profits. Equity investors are worried about what the world looks like now, and not fully optimistic about what the world will look like tomorrow either.
However, it is important to note that not all stocks are hurting right now. Indeed, among the S&P 500 – as of yesterday – the energy, utilities, and consumer staples sectors were all higher than three months ago (Chart 15). Firms that sell necessities have pricing power and are being rewarded by market participants. This is a theme that deserves further investigation.


The Commodity Boom-Bust-Boom
· When considering how likely the scenario of a “soft-landing” really is, it is worth looking at how much inflation momentum has been built up relative to recent historical events (Charts 16 & 17). The finance legend Ed Yardini invented a simple, but effective, measure of inflationary impulse he calls the Boom-Bust Index. The index is the Goldman Sachs Commodity Index divided by the number of initial unemployment claims. Clearly, the current inflationary impulse is unlike anything the Fed has dealt with in the twenty-first century. However, the boom could quickly turn to bust if rapid tightening initiates credit destruction.
· Note that the usual pro-cyclical relationship between commodity prices and emerging market equity prices has broken down due to the sharp increase in commodity prices (Chart 18). Normally higher commodity prices are good for emerging markets, but not if the adjustment is so sharp that it triggers a financial crisis.
· The bond market has been interpreting recent movements in energy prices as true changes in the supply/demand balance rather than just financial perturbations. The movement of the 10-year nominal rate has moved in concert with the oil/gold ratio, as would be expected in a market able to function normally (Chart 19).
· The situation is much murkier, and worrisome, when it comes to real interest rates and the price of gold. The usual inverse relationship between gold and real rates has temporarily broken down with gold holding steady while long-term real rates flap around (Charts 20 & 21). Clearly events in Ukraine have been a wind at the back of gold, but it is unusual that the price of the yellow metal has held up so well in the face of rising real rates. Either gold is due for a fall, or rising inflation will bring real rates down.
Clearly there is room for disagreement on whether we are headed for more inflation or a recession, and the determining factor will be whether the FOMC grasps the nettle or not. If the Fed hesitates, there are numerous factors – including consumer debt – that could keep the demand train rolling and inflation rising. We are likely to see an initial cool-off, but that will soon be followed by more inflation once tightening ceases.


Stocks to Watch
Changing market conditions are reflected in the changing composition of companies in this week’s Stocks to Watch, relative to recent inclusions. I have been focusing on companies with strong pricing power, very low betas to the wider stock market, and a solid dividend backed by plenty of free cash flow.
Keep reading with a 7-day free trial
Subscribe to Capitalist Pig Collective to keep reading this post and get 7 days of free access to the full post archives.