

The Weekly Beat: 8 November 2022
Yield Curve Endgame, Dollar Disasters, and Commodities

U.S. Bond Markets
· The release of the FOMC minutes on October 12th and the latest post-FOMC press conference on November 2nd sent shudders of excitement and volatility through bond markets. The Fed delivered the 75-bps rate increase expected by the market and alluded to a slowdown in the pace of rate hikes, also as expected.
· The volatility experienced by markets has been driven by a “higher for longer” rates scenario being added to the range of possibilities under consideration by the market. Since October 12th the entire yield curve has shifted up, but the shift came in two waves (Chart 1). The release of the minutes from the September FOMC meeting drove yield increases at the front end of the curve while the November meeting drove yield increases at the back of the curve (Chart 2).
· If the market expects the terminal rate for policy tightening to be higher than before and that the Fed will not intentionally invert the yield curve, then we are left with the conclusion that the bond market is realizing yield curve control is coming.
· After recent rounds of tightening the yield curve has been laid out flat with only 50-bps between fed funds and 3-month T-bills as a buffer before inversion (Charts 3 & 4). Looking only at the spreads might lead to the erroneous conclusion that yield curve inversion and a recession are a done deal. However, once we look at yields the picture is more complicated.
· As spreads have compressed the yields at differing maturities have stopped moving independently. For example, the three-month and five-year rates moved independently until almost crossing in late July (Chart 5). However, instead of crossing, the rates began to shadow each other. Weirder still, the positive spread has been doggedly maintained with the recent jump in the five-year relative to the three-month being a notable example.
· The back end of the curve has been transformed from a flexible cable transmitting signals across time and space into a fragile ossified pole that shifts and tilts but cannot bend (Chart 6). Eventually the fragility of the bond market and the need to maintain a positive spread will force the Fed’s hand and Yield Curve Control will be the response.
· Real rates initially moved with the Fed’s efforts to tighten but have been stagnant since late September (Charts 7 & 8). That is problematic for the Fed because it implies that further tightening must keep up with, but not pass, inflation – which will continue accelerating – or cause a major to unwind of financial assets and a liquidation of real capital.
· A meaningful push higher on real rates will require credit to continue flowing to high return projects while reducing consumer demand and investment in low-return projects. This is the eye of the needle the camel of monetary policy must pass through to avoid a smash-up. The Fed will see YCC as their best hope of success.
· The volatility of the gap between nominal and real yields (i.e. inflation expectations) will likely increase as the forces pulling between inflation and deflation become stronger (Charts 9 & 10). The pulling and pushing of opposing forces have been manifesting as strain in bond markets, but eventually this will be transmitted to the real economy. Even without higher inflation expectations, higher inflation volatility can ruin the Fed’s party by increasing the reactivity of businesses and consumers to changes in inflation.


Commodities and Currencies
· The combination of economic, monetary, and geopolitical uncertainty has had a devastating effect on currencies other than the dollar (Chart 11). Unfortunately, a rising dollar can quickly become a destructive economic force that gathers momentum as it wreaks havoc in a terrible feedback loop.
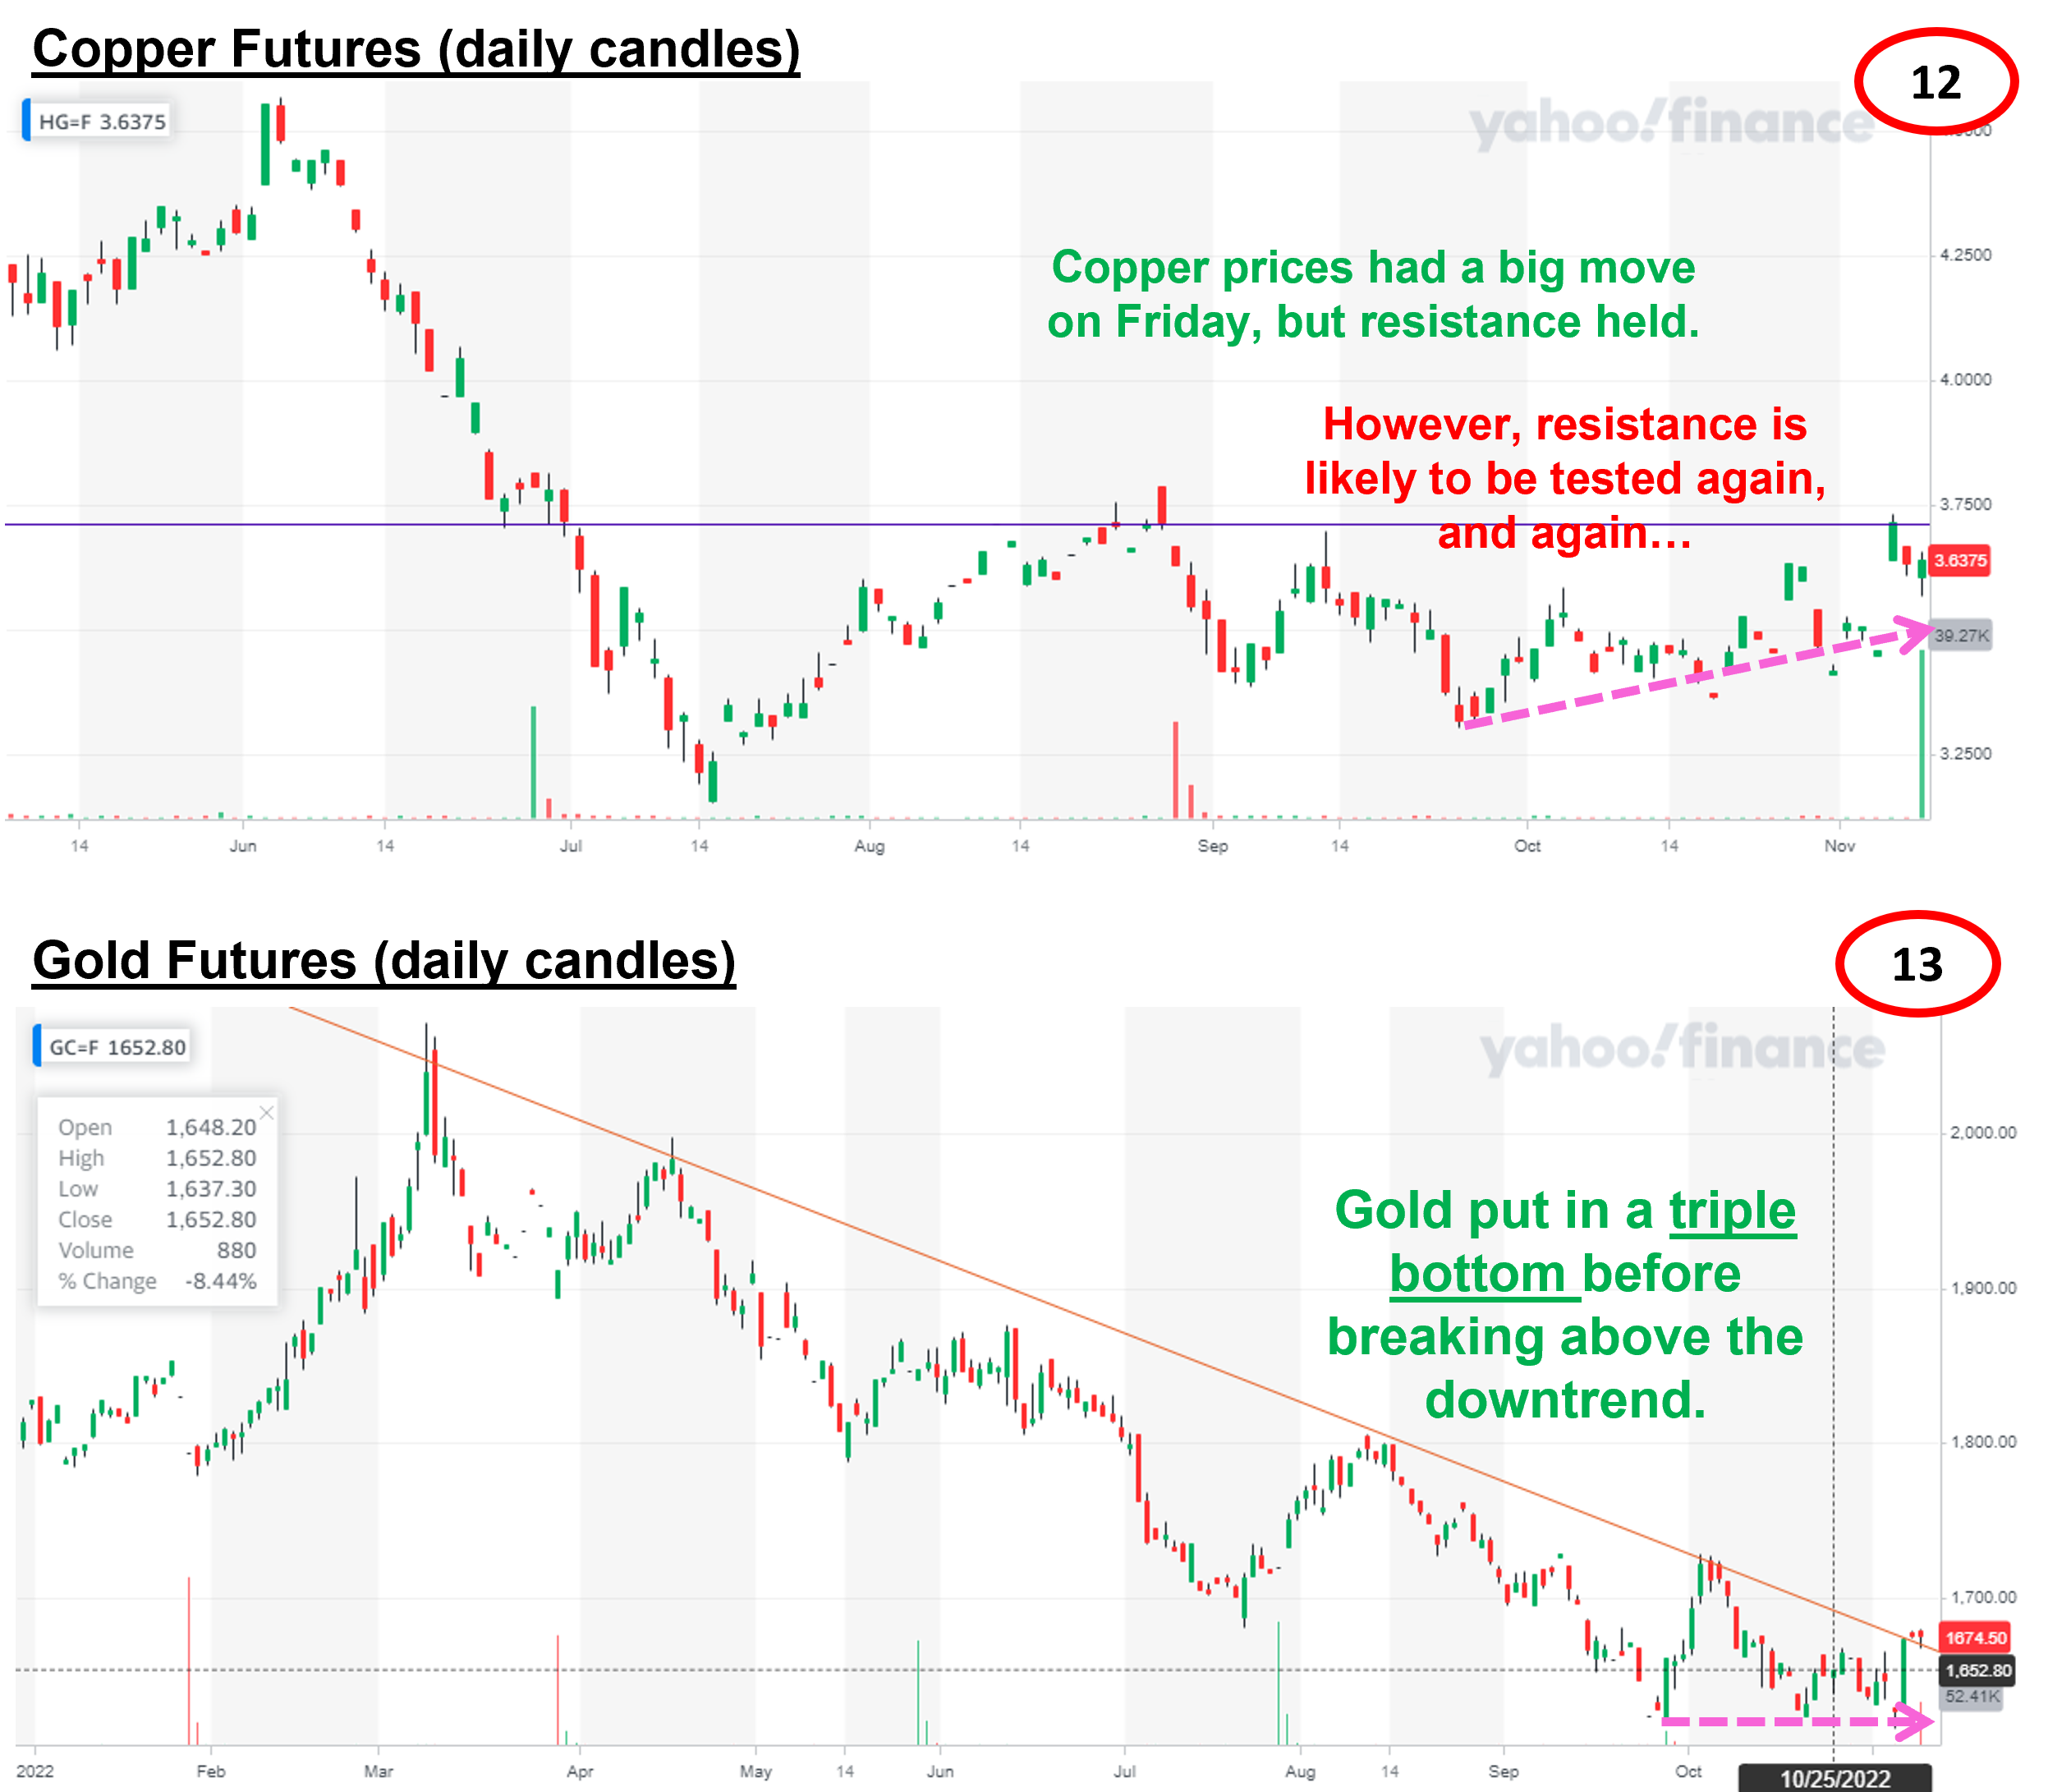
· The price action on Friday was very interesting and important, but the economic implications are not yet clear. Copper prices jumped, but they remained below a long-term resistance line (Chart 12). Notably, gold might have crossed out of its long-term downtrend (Chart 13). Gold prices put in a triple bottom recently, adding weight to the thesis that the price of gold has bottomed. That will certainly be the case if we’ve seen a top in real rates.
· While copper and oil prices have crossed some important psychological levels in dollar terms, the real price of these commodities remains well below 2007 levels (Chart 14). The recent turn in prices could test and even overcome the top in real prices seen over the past decade, but investors should make no assumptions (Chart 15).
· One hint that the market has downgraded oil’s status as a signpost for inflation is that the relationship between the 10-year Treasury and the real price of oil has broken down recently (Chart 16). Given that the U.S. is energy self-sufficient such a change in the market should not come as a surprise.
· Spot prices for oil and natural gas prices have swung wildly recently but their relative price is much more predictable. The domestic U.S. price for natural gas and the global price for LNG operate on a spot basis, but contract prices for pipeline-delivered natural gas have historically used the price of oil as a reference. As a result, when the price of one of these commodities gets stretched, arbitrage pulls it back temporarily (Chart 17).